Moving Average for Intraday
Intraday trading indicators, 200 ema breakout stocks, 5 ema strategy, Best ema for intraday
Course: [ Top Trading Strategy ]
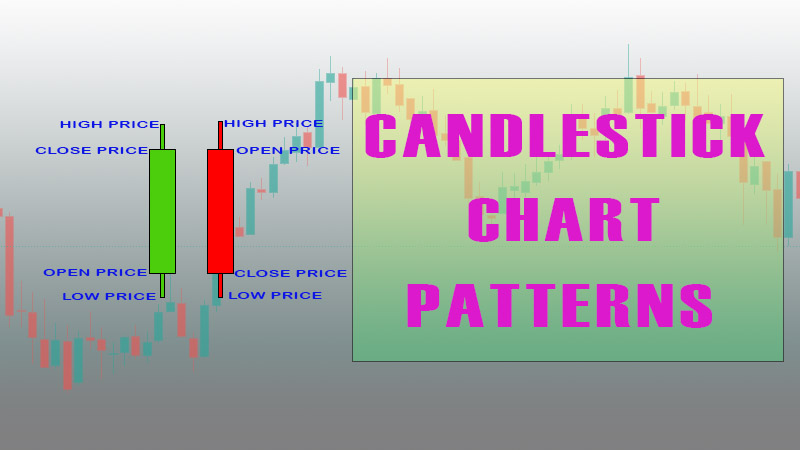
A moving average is the sum of whatever you’re examining. In this case, I’m talking about the closing prices of a stock.
Moving Averages
A moving average is the sum of whatever
you’re examining. In this case, I’m talking about the closing prices of a
stock. For example, a 20, 30, 50, 100 or 200 day moving average is then divided
by the total number of days, resulting in the average price of the stock. A 30 day
period is commonly used for short-term buy and sell signals.
As stocks move above the 30-day moving
average, it’s said that the stock has greater upside potential; and, as the
price drops down below the 30-day moving average it’s said that the stock has
greater odds of moving lower at that time. Such moving averages are helpful
when determining levels of support and resistance. As a habit, I have found
that once a stock drops below the 30-day moving average, it may be best to
place a stop loss order at a select price.
Also keep in mind that of all the various
moving averages, the 200-day moving average results in the strongest moving
average. This is simply because it is referred to as being a major point of support
or resistance for either stocks or Indexes.
Moving Averages Examined
Below is a good example of how to compute a
moving average. By adding the closing prices of this stock over the last 7
days, you get $393.93. Divide that result by the 7 days because each one of
those numbers represents 1 day. That process results in the average price of
the stock $56.27.
Example: $56.06 + $59.31 + $56 + $55.56
+ $56 + $57 and$56.26 = $393.93 Now divide
$393.93 by 7 (total number of days)
= $56.27 average price.
The first thing to remember about a moving
average is not its precise total but what that total represents. Whichever
moving average you’re looking at, its total represents the price of that stock
over that time frame. So if I’m looking at a 7-day moving average, and I’ve got
$56.27, that tells me that the average price of the stock over the last 7 days
was $56.27 because that’s the parameter I was using.
Stay focused on the fact that a moving
average represents the price of a stock within a certain period. So when using
such moving averages as the 30 or even the 200, it’s telling you what the
average price is for that given time frame.
Looking Back on Moving Averages
circa the 1990s
Moving averages have become extremely popular
again. I remember in 1997, ‘98, and ‘99, the only moving averages people were
looking at were 10s and 20s, maybe 30s. The 200-day moving average was so far
away from the actual current price of the stock, no one could locate it. As I
mention in my book Technical Charting for Profits, everyone now looks at
200-day moving averages as the strongest point of support or resistance because
stocks continue to change directions. So a 200-day moving average is taking a
major toll in the actual evaluation of a stock.
Two Main Types of Moving Averages
There are two primary types of moving averages:
·
Simple moving averages include less of a reaction, allowing for a
slower or more effective signal.
·
Exponential moving averages create more of a reaction, causing a
faster and less effective signal.
Various time frames are used in varying
market conditions. The shorter the moving average, the faster the movement will
be. And the larger the moving average, the slower the movement will be.
Now you’re saying to yourself why should a
shorter moving aver-
age and faster movement be important to me? A
good question:
40-day moving average, it’s going to take 30
or 40 days before you actually begin getting a sell signal. So by all means,
shorten some of those averages!
Which Moving Average Does Larson Rely On?
Now that we’ve covered the differences
between simple and exponential moving averages, I will tell you that I almost
always use a simple moving average, except with two different indicators. My
reason for this is simple: I’ve found that the exponential moving average with
those two indicators works best. And I’ve back-tested every approach I refer to
in this book for a minimum of 6 months before applying it to real money.

These days, people are using shorter moving
averages ranging from 10 to 30 days. Why? Because shorter moving averages help
investors identify both when to get into or out of a stock sooner rather than
later.
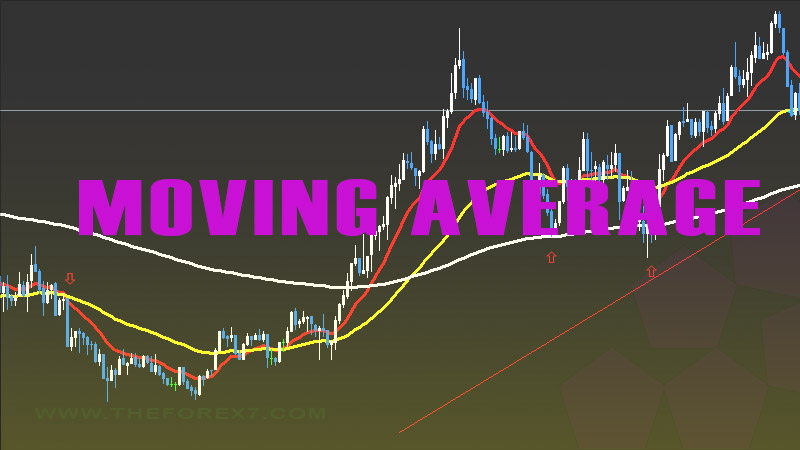
A chart on moving averages is shown in Figure
1. Though there are four averages here, I’m going to focus on the two larger
ones,the 10- and 20- day. Never go long or short unless these moving averages
cross. If you go directly up in the chart, you have a cross on these moving
averages. When you see the 10-day break down through the 20-day, it would be a
short opportunity or a sign of weakness in the stock. If it were the reverse,
it would be a buy opportunity or a sign of strength as the 10-day moving
average moved up through the 20-day moving average.
Moving Average Time Target: 3 Days
Another factor that you should consider with
this moving average is consecutive days. In this example, you should see a
specific average confirmed over at least 3 consecutive days, primarily because
there was a crossover of the moving averages.
What you see in Figure 1 is a simple 10- and
20-day moving average. This is resulting in a short (downward investment)
opportunity, right? Not necessarily. I use a 12-plus system, and this is how
I’ve set it up. There are 12 tabs on my charting system. I start by putting the
least effective one in tab 1 and the most effective one in tab 12. By the time
I go through 1 to 12, if I have more pluses than minuses, I consider taking on
the position. You can use various types of technical programs to create your
own 12 plus scenario. You may even utilize your most rewarding technical indicators
by adding them all on one chart so you can view them at the same time. I do
this from time to time by simply saving the setting and giving it a title “MY
SYSTEM” this gives me the ability to quickly review my most prized technical
indicators with just the push of a button. If you’re interested in all of my
prized technical indicators in “MY SYSTEM” and their details, look for my home
study course The Complete Guide to Technical Indicators.
If Figure 1 were tab 1, I would say that so
far, this would be a plus (assuming I wanted to short it). The 10-day has
crossed through the 20-day, which is a better signal in this case, and the
stock should move lower. But as I said, I would also wait 3 days to see how the
trade actually falls out before making a final determination.
Another important consideration in this case
is the 200-day moving average. As I discussed at the beginning of this
chapter, the 200-day moving average is still the strongest point of support. Although
this stock’s moving averages are crossed, the fact remains that it’s coming
down, testing its strongest point of support so I would still be patient. Wait
for it. Get another confirmation.

prior to the open of the market; and, when
stocks gap down, the price moved lower prior to the market open. This is simply
a sign of good (gap up) or bad (gap down) news taking place and the stock
market adjusting the price before the open. Stocks that gap up often move
higher, yet stocks that gap down often move down much more than stocks that gap
up.
So far, we’ve looked at moving averages
crossing each other. We’ve waited 3 consecutive days for the stock to follow
that current trend. Then we’ve looked for it to test the moving average. Here,
it broke below the moving average and also had a gap down. There’s a better
signal of weakness.
Moving over to the right side of the chart,
it says never go long or short unless these moving averages cross.
Yet as you can see in Figure 1, they started
to cross. We could have waited 3 days, and then have entered the trade at that
point. But we would have gotten out rather fast because we then saw another
crossover.
We’ve started off simply by looking at moving
averages, the 10- and 20-day. We’re going to add more indicators as we move
forward and create a system similar to my 12-plus system, which will tell us
when we should and shouldn’t buy.
You’ll often find that investors will add a
moving average to the volume to alert them when the volume
has increased above its daily average (Figure
2.2). This can be an early sign of a positive or a negative breakout. The
moving average time frames will vary with each investor’s objectives and the
market conditions.
Laws of Supply and Demand
You already know that the stock market moves
simply based on two things: supply and demand. Together, supply and demand are nothing
more than volume. If I have a basket loaded with green and yellow bananas, I
have a supply of a product to sell. The demand is determined based on how many
green or yellow bananas people want to buy. If green sells quicker than yellow,
there will be less supply and more demand for the green bananas. Prices will
react accordingly the price of green bananas in this case will rise to meet the
high demand and low supply situation.
When we start getting more supply and demand,
we see the market do one of two things. Obviously, when there’s more supply of
something, we talk about it. On the other hand, if no one wants to buy
anything, the stock isn’t going to do anything. But if everyone wants to buy
something, the stock will go up. Let’s take Apple Computers’ ipod as an
example; so much demand caused the increase of the price. As the interest
dropped, so did the price. Another great example of this is real estate value;
as interest rates drop, more people can afford to purchase homes, which will
then drive the values up. As interest rates increase, the demand for homes
drops, and so does the value. It is simply a world of supply and demand the
more we want something, the higher the price. The less of something we want,
the lower the price will go.
In the chart shown in Figure 2, we added a
20-day moving average to the volume. This way we can identify when the volume
is moving above its averages. Often, stocks that are trending upwards don’t
need volume unless they are testing levels of resistance. In fact, stocks that
are dropping in value truly don’t need volume either; however, many times
stocks that are trending sideways need volume to push them up or down. And as I
referenced before, I like to see a stock’s daily volume increase 1% times more
than the stock’s average volume over the past 20 days. This is a sign of commitment
and will increase the stock’s odds of moving, which in return, will increase
your odds of success.
So to start, I’ll tell you that we’re using
the same stock that we considered previously. As we look at the vertical line,
we see the same time frame we looked at for the short where we had a gap down
and a crossover in moving averages. But look at what begins to happen to the
volume after 5 months: all of a sudden, we start to see an increase in volume.
Increased volume will help push your stock in the direction it is going; and,
the more volume, the bigger the movement will be.
If I’m on to tab 2 of my 12-plus system, I’m
now getting another plus, because volume is increasing and the trend is
continuing to move down. In summary, we’re adding moving averages to our volume;
and, as the volume bars begin to increase above the average volume (past
20-day), we’re able to see early signs of buying or selling. This will help us
determine a sooner and often a better entry or exit point. As the saying goes
“timing” is the most important part of being a successful trader. It’s always
best to get in early and get out early.
·
A moving average is the average of a stock’s closing prices over a
defined period.
·
The first thing to remember about a moving average is not its
precise total—but what that total represents.
·
A moving average represents the price of a stock within a certain
period.
·
There are two types of moving averages: simple and exponential.
·
The shorter the moving average, the faster the movement will
be—and vice-versa.
·
You should confirm a moving average over at least 3 consecutive
days before acting on it.
·
The 200-day moving average remains the strongest point of support
or resistance.
·
A bullish position in a changing market means that you should
consider shortening your moving average, resulting in a quicker sell-signal.
Top Trading Strategy : Tag: Top Trading Strategy, Forex : Intraday trading indicators, 200 ema breakout stocks, 5 ema strategy, Best ema for intraday - Moving Average for Intraday