Kicker Signal Pattern
Bear Kicker, Bull Kicker, Kicker signal, bearish signals, kicker signal candlestick patterns, bullish kicker signal, Bearish kicker signal
Course: [ How To make High Profit In Candlestick Patterns : Chapter 1. The Major Candlestick Signals ]
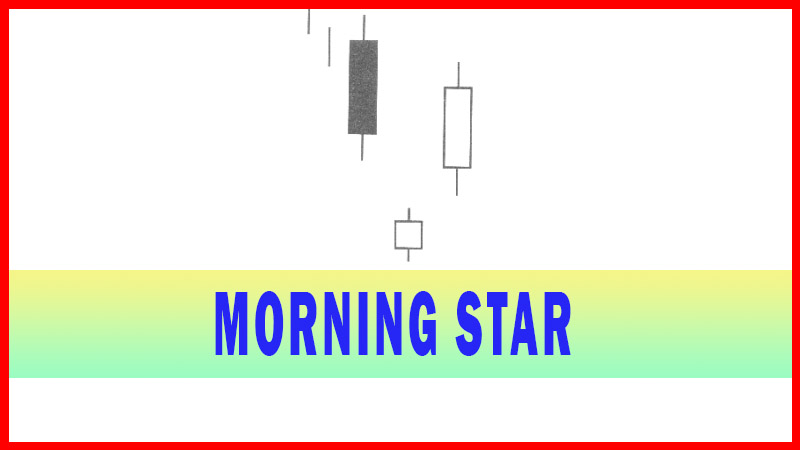
he Kicker signal is the strongest signal of all the major signals. It demonstrates a dramatic change in investor sentiment. Some occurrence caused a violent change in the direction of price.
KICKER SIGNAL (Keri Ashi)
Description
The Kicker signal is the strongest signal of all the major
signals. It
demonstrates a dramatic change in investor sentiment. Some occurrence caused a
violent change in the direction of price. Usually, a surprise news item or a
major world/ sector event is the cause of this type of move. The signal
illustrates such a dramatic change in the current direction that the new
direction will persist with strength for a good while. On a daily chart, that
time frame is usually two to three weeks.
While the
entry strategy after most bullish or bearish signals requires confirmed buying
or selling, the Kicker signal does not require confirmation. The magnitude of
the reversal resulting from a Kicker signal does not preclude some immediate
profit taking. Even on a pullback, after a Kicker signal has altered the trend,
it is usually safe to buy after a Bull Kicker or to sell into buying strength
after a Bear Kicker. The Kicker Signal works equally well in both directions.
The occurrence of a Kicker Signal in an overbought or oversold condition
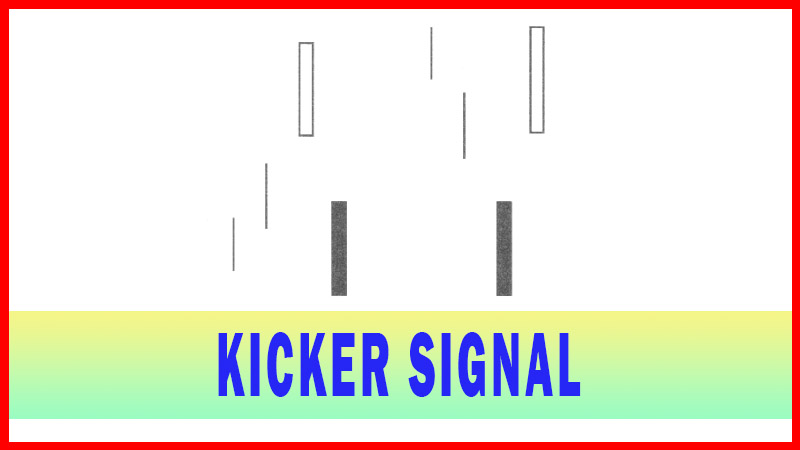
magnifies its relevance. It is formed by two candles. The first candle opens
and moves in the direction of the current trend. The second candle opens at the
same open of the previous day, a gap open, and continues in the opposite
direction of the previous day’s candle. The bodies of the candles are opposite
colors. This formation is indicative of a dramatic change in investor
sentiment. The candlesticks visually depict the magnitude of the change.
There is
one caveat to this signal. If the next day prices gap back the other way,
liquidate the trade immediately This does not happen very often, but when it
does, get out immediately. This usually means the event, which caused the
Kicker signal, has been corrected.
A Kicker
signal can also be created by a change of recommendation by a major brokerage
firm. Although the announcement has created the signal, usually the strength
in that scenario may not be as relevant. Be more diligent in watching for
selling indicators to occur. The uptrend may not possess as much strength as a
signal created by announcements or events that would change the fundamental outlook.
Criteria
1.
The first day’s open and the
second day’s open are the same or gaps beyond the previous open.. The price
movement is in opposite directions from the opening price.
2.
The trend has no relevance in a
kicker situation.
3.
The signal is usually formed by
surprise news before or after market hours.
4.
The price never retraces into the
previous day’s trading range.
Signal Enhancements
1.
The longer the candles, the more
dramatic the price reversal.
2.
Opening from yesterdays close to
yesterday’s open already is a gap. Additionally, gapping away from the
previous day’s open further enhances the reversal.
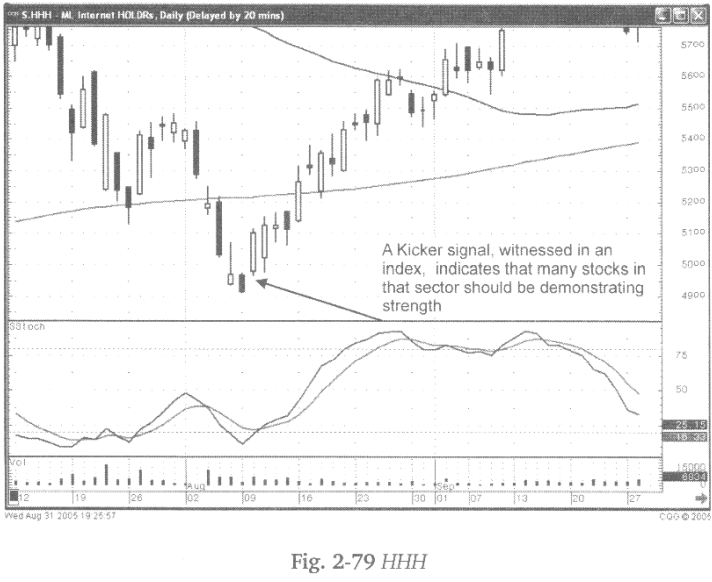
Witnessing
a Kicker signal in an index provides valuable information. Something has
happened in an industry/sector that is going to affect a number of stocks
participating in that index. Whatever news or event causing the Kicker signal
will make bullish signals in individual stocks in that sector that much more
effective. As viewed in Fig. 2-79, the Merrill Lynch Internet Holdings index
(HHH), a Kicker signal in oversold condition indicated the entire sector had
information that will affect a number of stocks.
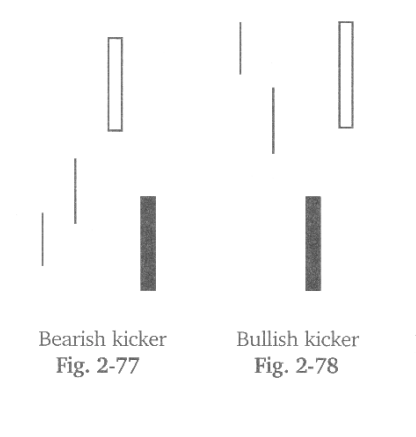
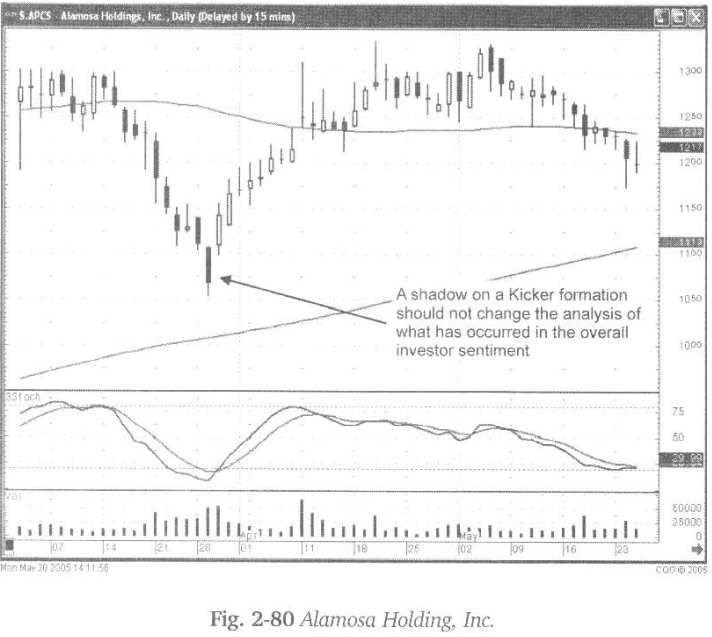
The true
Kicker signal does not have shadows on the body. The gap in price, going in the
opposite direction, should open and immediately move away from the previous
candle. However, the presence of a shadow should not negate the overall
analysis of the signal.
Even when
a shadow appears on the new candle, such as in Fig. 2-80, the Alamosa Holdings
Inc. chart, the result should still be obvious. The investor sentiment has
changed dramatically. The shadow at the bottom of the bullish candle should not
deter from the analysis that an uptrend should be starting with force.
The
signal is considered more effective when the bodies are both long bodies. A
long body formation to the downside illustrates strong investor sentiment in
the bearish direction. A long body bullish candle now has double connotation.
First, the price had to gap up the full length of the black body candle.
Secondly, once that gap up occurred, the buying force was shown to have continued
with strength.
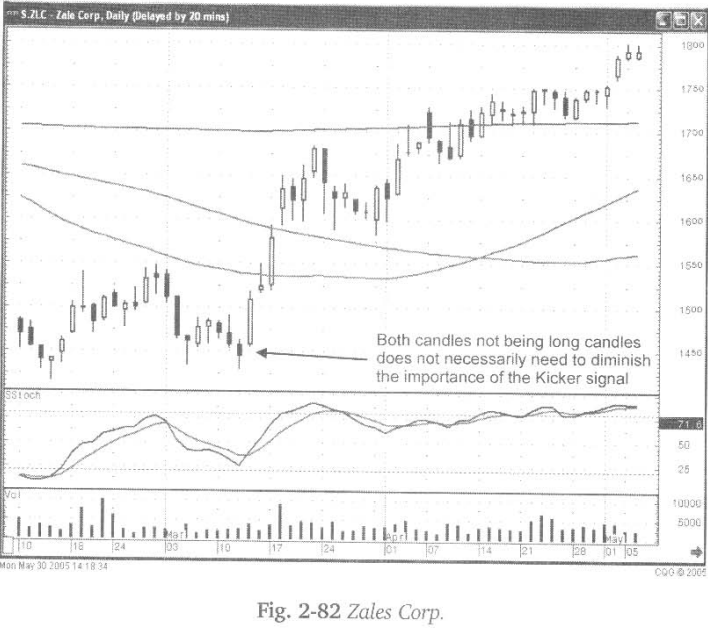
The effect
of a Kicker signal should not be disregarded if one of the two bodies forming a
signal is smaller than the other. The result remains the same.
The
investor sentiment made the price gap in the other direction and proceeded in
that opposite direction.
Technically,
a Spinning Top or a Doji with black bodies, followed by a gap- up long bullish
body could be considered a Kicker signal. While that pattern is just as
effective for identifying a strong reversal it would not necessarily fit into
the description of a Kicker signal. The long bodies better define the Kicker
signal.
Fig.
2-81, The Alkermes Inc. chart shows the downtrend was progressing with
reasonable strength. Whatever news announcement or event that occurred made the
new sentiment very bullish.
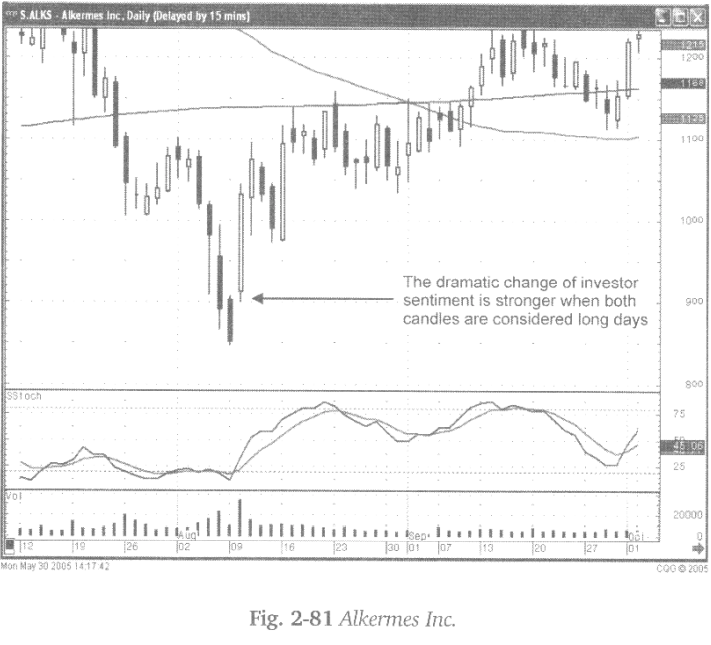
Fig.
2-82, the Zales Corp. chart demonstrates that both candles do not have to be
large candles, the kicker signal still reveals a definite change of the trend.
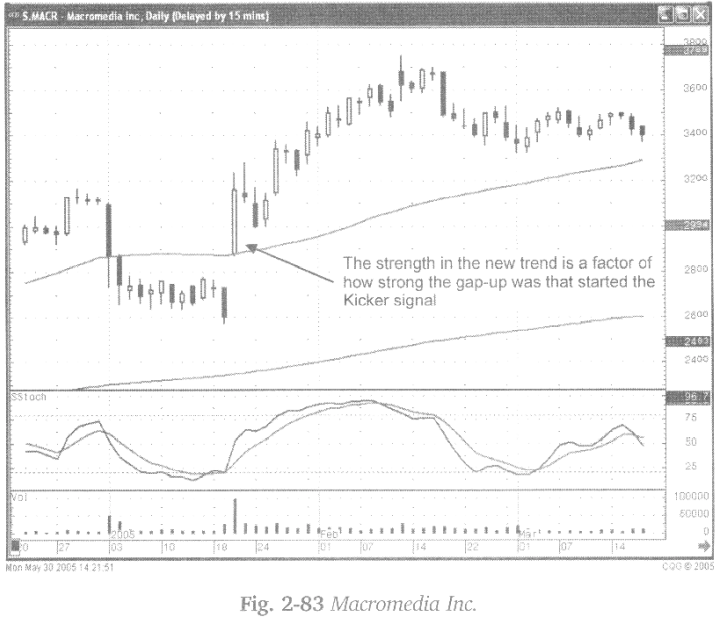
The
magnitude of the gap, above the previous days open, in a bullish candle has
great relevance. The gap up in price, followed immediately by added buying,
clearly reveals the strength in which buyers wanted to get into a position.
Illustrated
in Fig. 2-83, the Macromedia Inc. chart, is a price trend that clearly- had no
upward bias until the gap up Kicker signal occurred. As mentioned previously,
buying at any price during the next few days should be profitable. Some profit
taking is likely to occur after a big move to the upside. However, the signal
itself illustrates a dramatic change in investor sentiment. That change will
not disappear very soon. It can be anticipated that there will be a few weeks
to the uptrend.
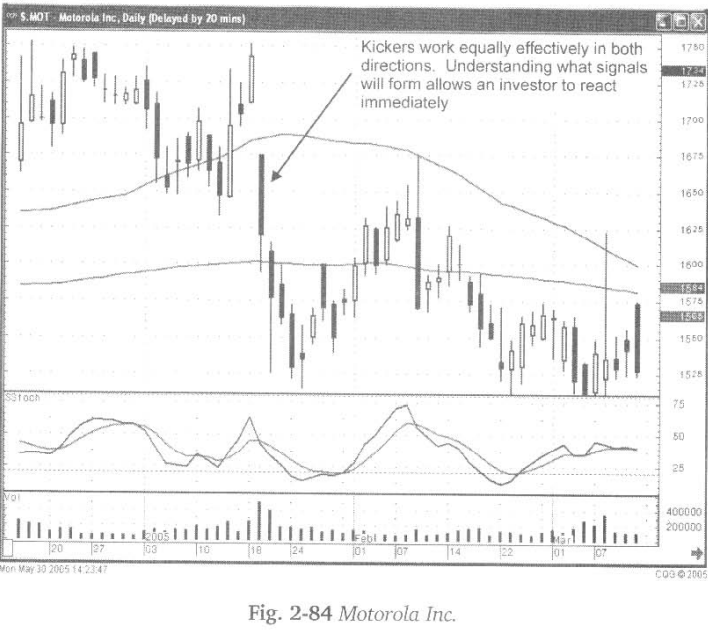
The
Kicker signal works equally as well to the downside as it does to the upside.
As illustrated in Fig. 2-84, the Motorola Inc. chart, the uptrend was immediately
terminated with a gap down in price below the previous days open. The
continuation of the selling revealed that the downtrend was going to persist.
Understanding the elements forming a Kicker signal allows the candlestick
investor to make immediate decisions. An investor that may have been long
Motorola Inc., seeing the gap-down open well below the previous days open
should have the insight to close the long position immediately. Rarely will a
news announcement produce a dramatic gap down open, then see the resuming of
the current trend. The results of that dramatic gap-down will usually be a
continuation of selling.
Kicker
signals produce powerful moves as well as high probability moves. They do not
occur very often. When they do occur, they should be analyzed immediately and
exploited. They will produce a high percentage of not only correct trades but
also very profitable trades.
How To make High Profit In Candlestick Patterns : Chapter 1. The Major Candlestick Signals : Tag: Candlestick Pattern Trading, Forex : Bear Kicker, Bull Kicker, Kicker signal, bearish signals, kicker signal candlestick patterns, bullish kicker signal, Bearish kicker signal - Kicker Signal Pattern