Swing Trading The F.A.S.T. Method
Keyword | Best way to trade forex profitably Forex trading tips secrets pdf | Successful forex trading strategies | How to be a successful forex trader pdf | How to trade forex for beginners | Forex t
Course: [ Top Trading Strategy ]
Swing trading is based on identifying swings in stocks, commodities, and currencies that take place over a period of days. A swing trade may take a few days to a few weeks to work out. Swing trading is ideal for people who may not be able to trade during certain hours, or monitor their charts frequently
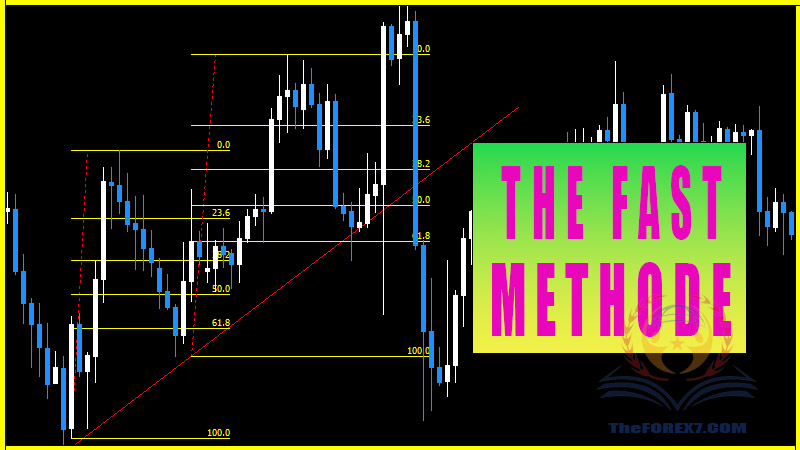
The F.A.S.T. Method
Swing Trading the F.A.S.T. Method
Swing
trading is based on identifying swings in stocks, commodities, and
currencies that take place over a period of days. A swing trade may take a few
days to a few weeks to work out. Swing trading is ideal for people who may not
be able to trade during certain hours, or monitor their charts frequently (i.e.
working a full-time job).
The
F.A.S.T. Method is our swing trading strategy that means "Fibonacci,
Analyze Trend, Supply & demand, Trendlines". The overall setup of this
strategy is to create a directional bias based on the current trend of the
higher timeframe. You will then use Fibonacci, Supply & Demand, and
Trendlines to enter a trade at a potential turning point before price continues
in the direction on the overall trend. This strategy is best applied to the
larger time frames (Wk, D, 4hr) for use in swing trading.
Although
ordered F.A.S.T., typically the order in which I will analyze will be as
follows:
A: Analyze Trend - The
very first thing I do when I open a fresh chart is go to the Weekly timeframe
and decide what the overall trend bias is. Because I primarily swing trade, the
main timeframes I use are the Weekly, Daily, and 4hr. I will decide the trend
based on if price is making Higher Highs and Higher Lows, or Lower Highs and
Lower Lows. Once i determine an overall trend bias, I move on to the next step.
S: Supply & Demand - I then
begin drawing the major supply and demand zones on each chart, starting with
the weekly. After I get the Weekly zones drawn, I drop down to the Daily and
4hr timeframes and do the same. At this time I will also being planning trades
that are in alignment with the overall (Weekly) trend.
T: Trendlines -
Trendlines alone dont hold enough weight for me, but when combined with a
supply or demand zone, they can be very powerful. Trendlines are used mainly
for confirmation, although they will not always be present for valid trades.
F: Fibonacci - The
last step is fibonacci, and is only used for extra confirmation. It is usually
a very nice and reliable setup when a Supply or Demand zone lines up with a
Trendline and a Fibonacci level. Paired with trading in the overall trend
direction, these setups can yield very powerful returns, and it is what we call
the F.A.S.T. Method.
Day Trading The F.A.S.T. Method
Day
trading is based on identifying opportunities in stocks, commodities, and
currencies that take place over a period of a few minutes or hours. A day trade
is typically opened and closed within the same trading day. Day trading is
ideal for people who have more of an open schedule, and enjoy monitoring their
charts frequently. A benefit of day trading is being able to close your profit
(or loss) for the day, which puts your account at less exposure and allows you
access to funds quicker.
Day
Trading the F.A.S.T. Method is possible by using lower timeframes, typically
the 4hr, 1hr, and 15 min. You can also use the Daily, 4hr, and 1hr time frames
for slightly longer trades. Overall, it is best to pick 3 main timeframes and
stick to those. When you analyze too many timeframes and charts, you may have a
hard time identifying opportunities or making a
trading decision.
Day Trade Live Example
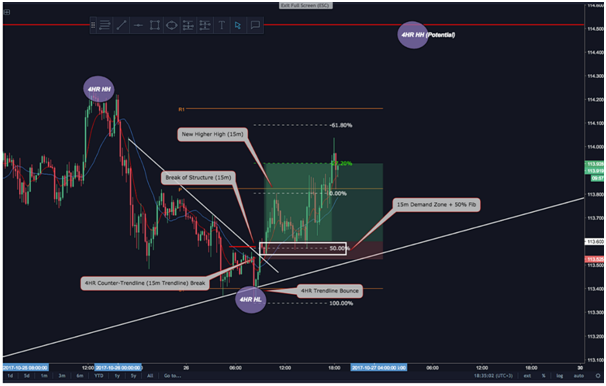
Trade Summary:
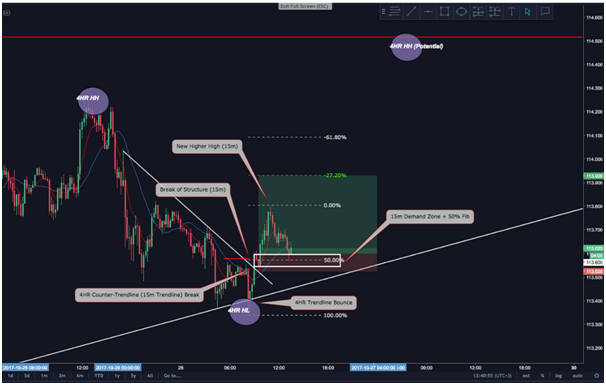
I decided to place a
quick day trade using the 4hr, 1hr, and 15m timeframes.
Above is the 15m chart. The
overall direction was bullish due to the 4HR timeframe being on an uptrend and
bouncing from an ascending trendline for the 3rd time. The 1hr timeframe
had a similar structure. I then went to the 15m time frame and saw that price
broke out of a 15m consolidation, broke through a 15m descending trendline
(counter-trendline on the 4hr & 1hr) and broke the 15m supply zones above
& structure (Break of Structure) towards the upside. As price began to
retrace on the 15m chart back to the newly formed 15m demand zone, I drew a
Fibonacci from the 15m swing low to the new swing high, and the 15m demand zone
lined up perfectly with the 50% Fibonacci level. When the price retraced to
this level I entered 1 Standard Lot, and placed my stop loss below the distal
line of the demand zone at -7.5 pips. This gave me a maximum risk of only $75.
I then used the 127% extension as an area for my profit target at +33 pips.
This gave me a potential reward of $330 and an amazing risk-reward ratio of
more than 1:4!
Top Trading Strategy : Tag: Top Trading Strategy, Forex : Keyword | Best way to trade forex profitably Forex trading tips secrets pdf | Successful forex trading strategies | How to be a successful forex trader pdf | How to trade forex for beginners | Forex t - Swing Trading The F.A.S.T. Method