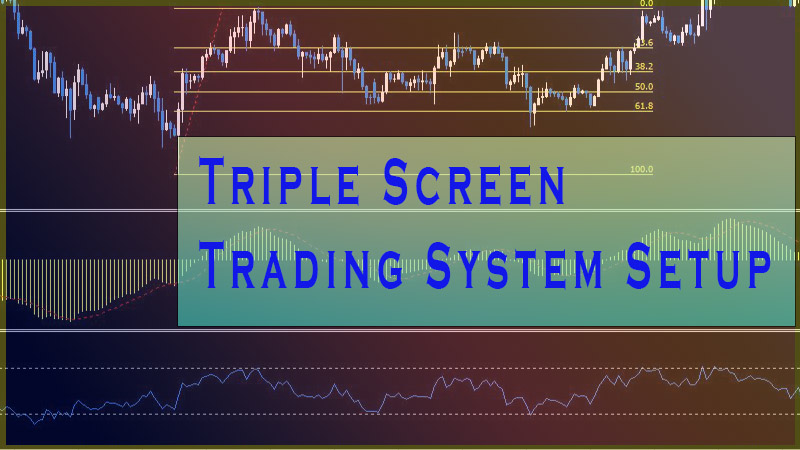
Triple Screen Trading System Setup
Trading Setup, Tips for Trading Setup, Multiple Screen Trading Setup
Course: [ Top Trading Strategy ]
The first screen that you should analyze is the long-term chart. If you are a day or swing trader, I would recommend the daily or weekly chart.
Triple Screen Setup
Step 1: First Screen
The first screen that you should analyze
is the long-term chart. If you are a day or swing trader, I would recommend the
daily or weekly chart. You may add the following suggestions to this screen:
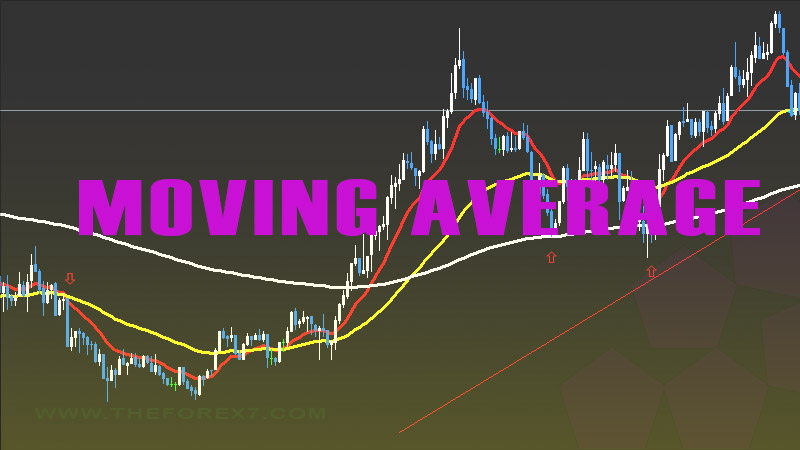
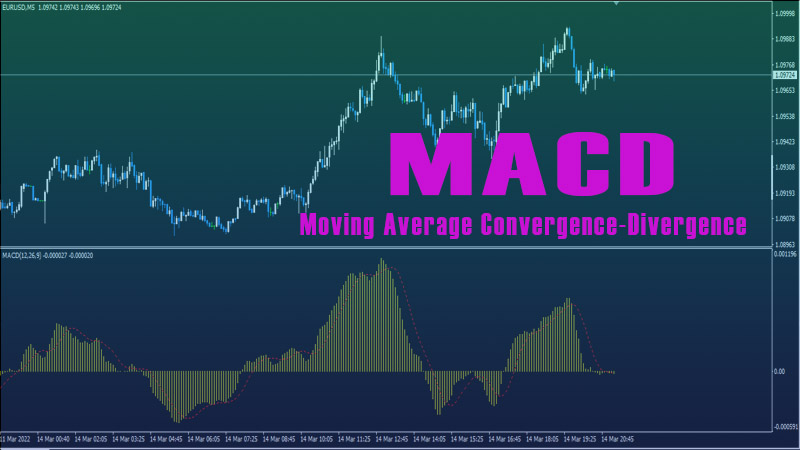
· Trend-following indicators: You
may include simple and exponential moving averages, MACD Histogram or whatever
you prefer to use.
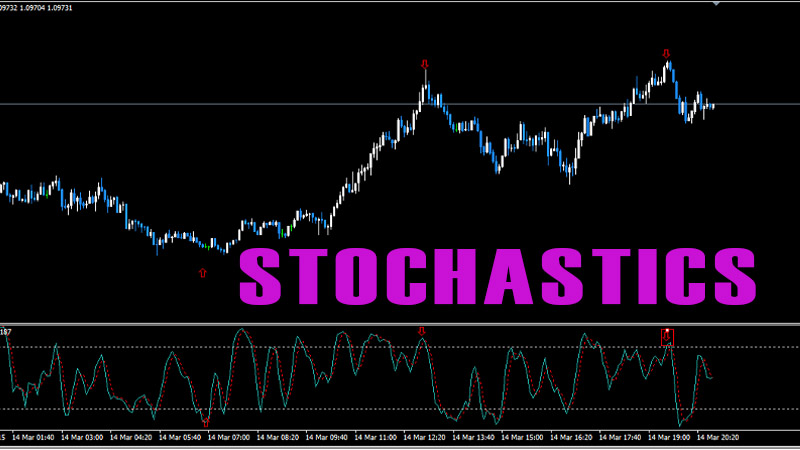
· Oscillators: You may include Slow
Stochastic, MACD Histogram (also used as trend indicator) or RSI or whatever
you prefer to use.
· Fibonacci retracements
· Trend lines
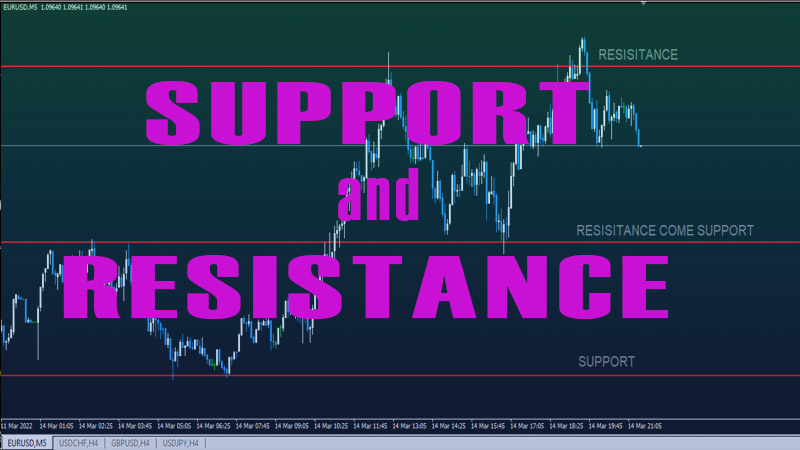
· Support and resistance points.
Look at the most recent trend line.
Is it up or down or sideways? Are the most recent candles up or down? Has the
currency just bounced off recent support or resistance? This will give you a
visual representation of the trend.
Figure 1 below shows you an example
of how a daily chart may be set up. The black horizontal lines on the price
chart indicate the Fibonacci retracements drawn from the swing high and swing
low. Note that the prices bounced off the Fibonacci levels as predicted.
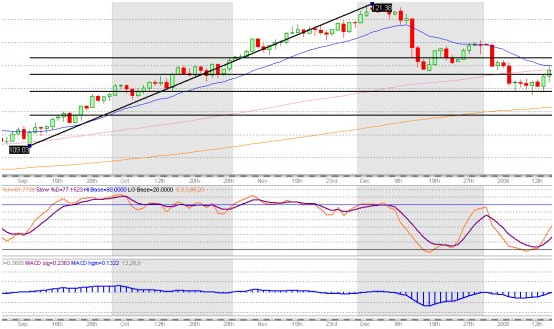
Figure 1
Step 2: Second Screen
The second screen that you should analyze is the
intermediate chart. If you are a day or swing trader, I would recommend the 60
min chart. Simply incorporate the same stuff to the 60 min chart as you would
the daily chart mentioned above.
Step 3: Third Screen
If you are a day or swing trader, I would recommend
the 5 min chart as the short-term chart. This is the one that you should be
constantly monitoring for short-term price actions. You may add the following
suggestions to this screen:
· Trend-following
indicators: You may include simple and exponential moving averages
· Oscillators:
You may include Slow Stochastic or whatever oscillator you prefer to use
· Support
and resistance points (intraday, previous days' highs and lows)
· Trend
lines (least important)
Tips for Setup
· You may
wish to use 22-EMA and 200-SMA for the 5 min chart, and add 100-SMA in addition
to these two to both the 60 min and daily chart.
· You can
use the default settings for Slow Stochastic and MACD Histogram.
· Set
different colors for your various moving averages.
· Set
different colors for support and resistance lines, and keep them consistent for
all your charts (for example, blue for resistance, black for support).
Top Trading Strategy : Tag: Top Trading Strategy, Forex : Trading Setup, Tips for Trading Setup, Multiple Screen Trading Setup - Triple Screen Trading System Setup