Types Of Trend Lines in Forex Trading
Trendline Analysis | Trendline Patterns | Trendline Breakout Strategy
Course: [ Top Trading Strategy ]

Trendlines are one of the most simple, yet effective tools of technical analysis. As a market moves in a series of waves, with periods of expansion and contraction, peaks (tops) and troughs (bottoms) will form, and along these points, trendlines are drawn. Trendlines can be horizontal in a trading range, or ascending in an uptrend, or descending in a downtrend. Trendlines act as support or resistance in themselves and act as a graphic way of representing the underlying trend.
Trends and Trend lines
Types of Trends
Trends are used to determine the relative direction
of prices in a market over different time periods. The ability to first determine a
trend direction is the basis of technical trading. There are mainly three types
of trends: Primary (long-term), intermediate (medium-term), and short-term.
Primary trend: Generally
lasts between 9 months and 2 years. This is the major trend.
Intermediate trend: Within
a primary trend, there will be counter-cyclical trends, and such price
movements form the intermediate trend. It generally lasts from 6 weeks to as
long as 9 months.
Short-term trend: Just
like the intermediate trend interrupts the primary trend, the short-term trend
interrupts the course of the intermediate trend. It generally lasts from 1 week
to as long as a month. In Forex, short-term trends are a good way to trade
because there are many explosive short-term price movements that can lead to
significant profit opportunities.
Identify the primary trend, the intermediate trend,
and the short-term trend, and then construct your trades in that direction,
based on the time frame used in your trading approach.
A very important thing to keep in mind is this: “The trend is your friend until the end”. It pays
not to go against the trend unless you have reversal signals based on
technical or market sentiment.
Trend Directions
Uptrend - In an uptrend, the base currency
appreciates in value. It is characterized by a series of higher highs and
higher lows.
Downtrend - In a downtrend, the base currency
depreciates in value. It is characterized by a series of lower highs and lower
lows.
Sideways – The currency prices are moving within a
narrow range, and are neither appreciating or depreciating in value.
What is a Trendline?
Trendlines are one of the most simple, yet
effective tools of technical analysis. As a market moves in a series of waves,
with periods of expansion and contraction, peaks (tops) and troughs (bottoms)
will form, and along these points, trendlines are drawn. Trendlines can be
horizontal in a trading range, or ascending in an uptrend, or descending in a
downtrend. Trendlines act as support or resistance in themselves and act as a
graphic way of representing the underlying trend.
How to Use Trendlines with Currencies?
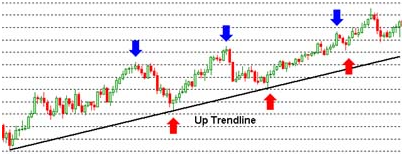
In order to draw an up trendline, you draw a line
connecting a series of bottoms. Your line need not necessarily connect all the
bottoms of the uptrend, as long as it connects a minimum of two bottom points.
This becomes your up trendline, with the trendline acting as support.
Figure 1 shows a daily chart of NZD/USD with an up trendline. The blue arrows indicate higher highs while the red arrows indicate higher lows, representative of an uptrend.
Figure
1
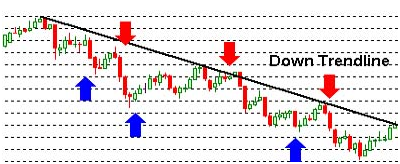
In order to draw a down trendline, you draw a line
connecting a series of peaks, and again, your line may not necessarily touch
all the tops of the downtrend, as long as it connects a minimum of two rally
points. This forms your down trendline, with the trendline acting as resistance.
Figure 2 below shows a daily chart of NZD/USD with
a down trendline. The red arrows indicate lower highs while the blue arrows
indicate lower lows, representative of a downtrend.
Figure
2
From experience, I find it more useful to connect
the highs or lows of candles, rather than to construct trendlines using closing
prices.
Trendline Breaks
An up trendline represents points of support,
whereas a down trendline represents points of resistance. Hence, when these
lines are violated, there are two implications for the future course of prices.
A trendline break could signal a reversal or continuation of trend. In the case
of trend continuation, this break may indicate a temporary interruption in the
prevailing trend or signal that the trend will continue, but at a slower pace.
How can you tell whether it is signaling reversal
or consolidation? You can't really tell from trendline breaks alone, but if you
can combine with other chart patterns like a head-and-shoulders pattern
(which you will learn in another lesson), you will have a better chance of
predicting the outcome.
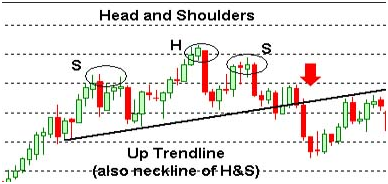
Figure 3 below shows a weekly chart of NZD/USD. The
up trendline is also the neckline of a head-and-shoulders pattern. While the H&S is in the
process of completion, it gives you a clue about a possible trend reversal
should this up trendline breaks. After an initial false break, the NZD/USD
finally broke decisively below this trendline/neckline, and the trend reversed.
Figure
3
Usually, an initial trendline, especially if drawn
on a long-term chart (e.g., daily chart), will give way to either a steeper or
shallower second trendline over time, and the second trendline may then later
give way to a third trendline.
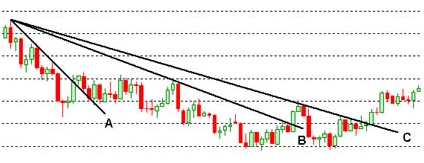
Figure 4 below shows a daily chart of EUR/USD. A is
the first down trendline, and when the price broke above trendline A, there was
a period of consolidation, before the downtrend resumed at a slower pace,
and that was when the second down trendline B was formed. When the price broke
above trendline B, it again interrupted and slowed the downtrend, and gave rise
to the third down trendline C. As you can observe, the trendlines subsequently
became less and less steep. Eventually, the trend reversed when EUR/USD broke
above trendline C.
Figure
4
Trendline Extensions
Once trendlines are violated, they tend to reverse
their roles as support and resistance. An up-trendline, once violated,
will become resistance, whereas a down-trendline will become support when
broken. Hence, it is very useful to extend your up or down trendlines even
after they have been violated because then you can see the new potential barrier
more clearly in future price action.
If a trendline has been very strong support or
resistance before the break, you can expect it to be a very strong resistance
or support respectively after the break has taken place.
Refer to Figure 3 again. You can see that the
extended up trendline later became a strong resistance for the currency pair.
Significance Of Trendlines in Forex Charts
You can evaluate the significance of trendlines
using the following guidelines:
·
Time period spanning the
trendline
As with all chart patterns, the amount of time taken to form
the trendline is proportional to its significance. A trendline formed over
several months or years will be more significant than one that is formed over
several weeks or days. A violation of a trendline that has taken a long time to
form will mark a significant juncture point. Remember that big trends result in
big signals, and small trends result in small signals.
·
Number of times the trendline
has been approached or touched
The more times a trendline is touched or approached, the more
significant that line is. In the case of an up trendline, it acts as a dynamic
support line, and so with each bounce,
·
Steepness of the trendline
The steeper a trendline, the more unsustainable it is, and
hence the less significant it is. Violations of steep trendlines are often
followed by consolidations rather than reversals.
Trend Channels
A trend channel consists of two trendlines, which
can be drawn in parallel to each other. The higher line acts as the resistance
line while the lower line acts as the support. A trend channel can be upward,
downward, or sideways. In an up channel, buying bounces off the support line can
be a good trading opportunity. In a down channel, selling bounces off the
resistance line can be a good trading opportunity.
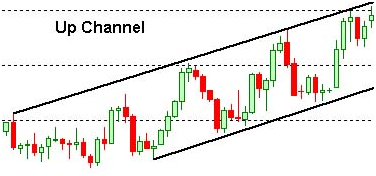
Figure 5 shows an up channel in a daily chart of
EUR/USD. Note that the two trendlines are parallel to each other and are
excellent places to short the resistance and to long the support.
Figure
5
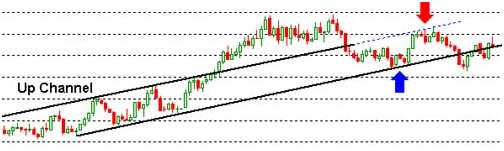
Figure 6
below is an extension of Figure 5, showing the up channel extension even after
EUR/USD had already broken out of the upper line. The dotted blue line is the
extension of the upper line, and the red arrow indicates that the extended
upper line again became a very strong resistance, even though the currency pair
had broken above and back within the up channel. The blue arrow points to where
the extended lower line again became very support.
Figure
6
For an up channel, when the price breaks above the
upper resistance line, one of two things is likely to happen: either the
uptrend accelerates or the move is temporary (exhaustion move). The same goes
for a price break below the lower support line. The steeper the trend channel,
the more likely an exhaustion move will occur.
Trading Tips
· Trade in
the direction of the trend. In an uptrend, look for buying opportunities when
the currency pair approaches the up-trendline, and place your protective stop
at least 15 pips below. In a downtrend, place short orders when the price
approaches the down trendline, and place your protective stops at least 15 pips
above. Too tight a stop is not advisable because we are talking about
support/resistance areas, not specific price points. Another reason is that
other traders may not draw the trendline exactly as you do, and this gives an
extra allowance for differing judgment.
· When
market sentiment changes based on fundamental reasons like interest rate hikes
for a particular currency, think twice before buying on an up-trendline or
selling near the down-trendline because this change in sentiment may very
likely induce a trendline breakout.
· Always
note the steepness of a trendline because it can tell you how sustainable the
pace of the trend can continue.
· Remember
that trendline breaks can either result in trend reversal or continuation. You
can't predict which beforehand, but you could gather clues from the chart or
from market chatter.
Related Article
Top Trading Strategy : Tag: Top Trading Strategy, Forex : Trendline Analysis | Trendline Patterns | Trendline Breakout Strategy - Types Of Trend Lines in Forex Trading