Types of Stop Orders
Types of stoploss, Money management, Chart-Based Stop, Volatility-Based Stop, Percentage-Based Stop
Course: [ Top Trading Strategy ]
This is the most common of all stops. The trader must first decide how much percentage of his total equity he is willing to risk on a single trade. As already mentioned in Part 2 of Money Management, if you risk a certain percentage, say 3% on a trade, you work out your stop loss in pips and your lot size according to the 'fixed cost' of risk
Types Of Stop Orders
1. Percentage-Based Stop
This is the most common of all stops. The trader
must first decide how much percentage of his total equity he is willing to risk
on a single trade. As already mentioned in Part 2 of Money Management, if you
risk a certain percentage, say 3% on a trade, you work out your stop loss in
pips and your lot size according to the 'fixed cost' of risk. Do not place an
arbitrary stop on your position. Always make sure that you analyze the charts
for the next significant support or resistance levels to give an idea of where
is safe to leave your stop, and once you have calculated your stop loss in
pips, adjust your lot size accordingly so that the amount at risk does not
exceed your pre-determined percentage risked.
2. Volatility-Based Stop
Although still taking into account not risking
more than 3% on a trade, a volatility-based stop is used, instead of price
action, to set risk parameters. This method of placing stops is based on
adapting your stop to the current market conditions. When the Forex market is
experiencing high volatility, whereby prices traverse a larger range, the
trader must adapt to this high volatility, and give more allowance for the stop
so as to avoid being stopped out by intra-day market noise. The opposite holds
true for a less volatile Forex market, whereby you can compress your risk
parameters accordingly.
Bollinger Bands
Bollinger Bands are a type of envelope that are
plotted at standard deviation levels above and below a moving average. This
results in a widening of bands during periods of higher volatility, and a
contraction of bands during less volatile periods. Bollinger bands allow for an
understanding of changes in supply and demand for the underlying security as a
quick view. Often there is a cluster of stop orders outside of the current
trading range to protect against a breakout of the current trading range.
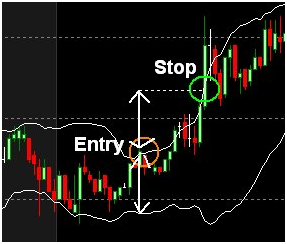
One way to place a stop using Bollinger bands
during a period of high volatility is to measure the bandwidth of the Bollinger
bands around the time of entry, and project half of that bandwidth from your
entry price. You can then place your stop at that projected point. Figure 1
shows a 60 min chart of GBP/USD, with a bandwidth measuring around 95 pips from
one end of the band to the other. So the estimated stop is half of that amount
projected from your entry point, as indicated by the green circle.
 Figure
1
Figure
1
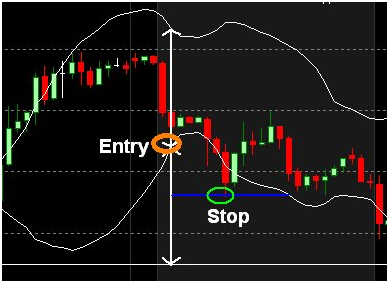
If the currency pair has low volatility at the
point of entry, project the entire bandwidth of the Bollinger bands from your
entry point to place your stop there. Figure 2 shows a 15 min chart of USD/JPY,
with a bandwidth measuring around 15 pips (low volatility). The green circle
indicates the point of stop as projected by the bandwidth from the point of
entry (circled orange).
 Figure
2
Figure
2
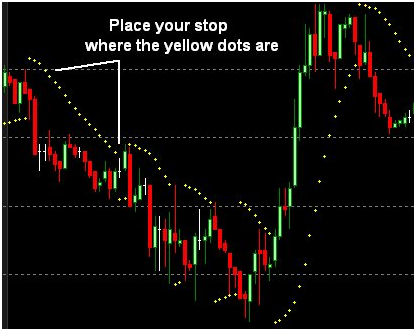
Parabolic SAR
Developed by Welles Wilder, the Parabolic SAR
("stop and reverse") sets trailing price stops for long or short
positions, which are indicated by small dots on the currency chart. The
"stop and reverse" indicates when the trader should close his
position or open an opposing position when this switch takes place. These price
stops are dynamic, meaning they move incrementally along with changes in
currency price.
In an uptrend, a long position should be
established with a trailing stop that will move up every bar/candle (whatever
the time period you are monitoring) until activated by the price falling to the
stop level. In a downtrend, a short position can be established with a trailing
stop that will move down every bar/candle (whatever the time period you are
monitoring) until activated by the price rising to the stop level. Refer to
Figure 3.
 Figure
3
Figure
3
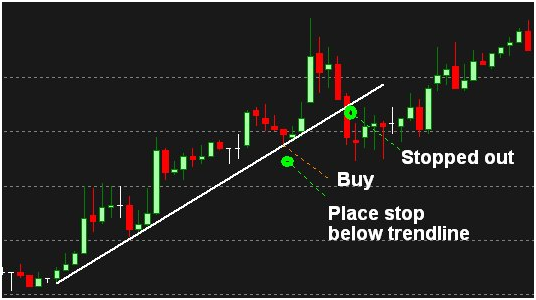
3. Chart-Based Stop
This often relies on a break in a trendline,
moving average, or another key measure of support or resistance like Swing Low or
Swing High. For example, if you trade a breakout of a Double Top chart pattern,
a chart-based stop would be placed slightly above the neckline of the Double
Top, since previous support should most likely act as future resistance.
Another example of a chart-based stop is
illustrated in Figure 4, whereby if you trade the bounce of an up trendline
for a currency pair, a chart-based stop would be placed slightly below the
trendline support, and be periodically adjusted as the trendline slopes higher.
 Figure
4
Figure
4
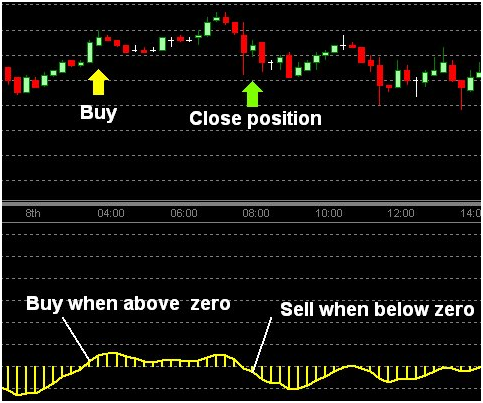
4. Indicator-Based Stops
If you have entered your trades based on
indicator signals, your stop could also be based on signals from the indicator
that you are using.
For example, you may have a buy signal for a
currency pair when the MACD crosses up above its zero signal line, so a
MACD-based stop, in this case, would be activated by the MACD reversing its
previous signal by crossing back below the zero signal line (Refer to Figure
5).
 Figure
5
Figure
5
The problem with using trend-following
indicators (such as MACD) as stops is that they are lagging, meaning that the
currency pair may have reversed its direction suddenly, and you will still have
to wait for the lagging indicator, like MACD, to catch up before you can cut
your losses.
Likewise, for any other indicators or
oscillators that you may use for entering trades, you can also activate your
stops based on the opposing signals. For example, if you have a buy signal for
a currency pair when the Slow Stochastics crosses up above its oversold line,
your stop could be activated when the oscillator moves back down into the
oversold area.
Trading Tips
- Some
people also use time-based stops in their trading whereby they time how
long they want to be in the market for, and if the time is up, they close
their positions accordingly.
- My
personal preference is to use a percentage-based stop as I find it the
most suitable for my trading style. Find one that suits your own trading style.
- No
matter what type of stops you use, always make sure that you do not risk
more than the pre-determined percentage of your total equity on a single
trade.
Top Trading Strategy : Tag: Top Trading Strategy, Forex : Types of stoploss, Money management, Chart-Based Stop, Volatility-Based Stop, Percentage-Based Stop - Types of Stop Orders