Forex Trading Support and Resistance Strategy – Step by Step Trading Guide
Find Resistance Levels, Buying at support levels, Selling at the resistance levels
Course: [ Top Trading Strategy ]
Trading Support and Resistance Find Resistance Levels Open your chart and find the highest price level.
Trading Support and Resistance
Find Resistance Levels
·
Open your chart and
find the highest price level.
·
Now place a line on the
chart and move it down the first resistance level that you find
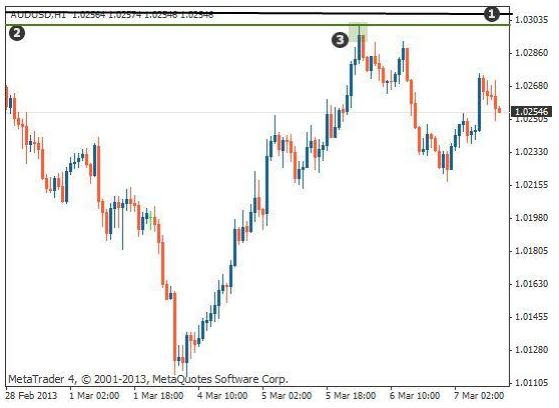
1. Line is drawn at top of the chart
that you will move down.
2.
Price
level that you will move the line down to.
3. The green shaded area identifies the
first resistance level.
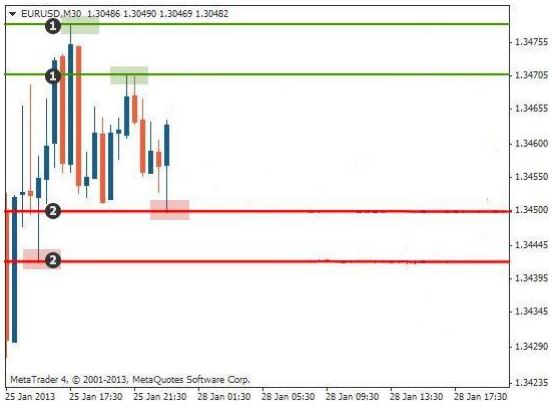
Place a second line on the chart and move it down,
below the current line you already have on the chart, until you find the next
resistance level as the following chart shows.
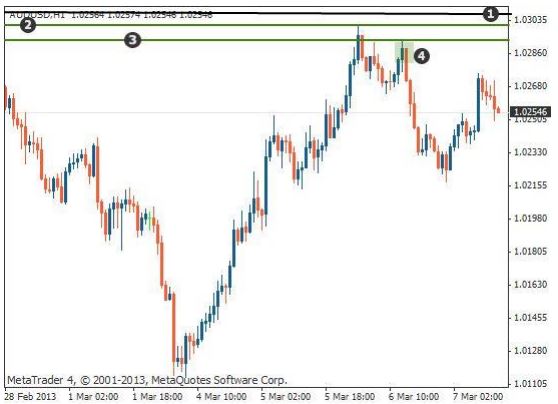
1. Line is drawn at the top of the chart
that you will move down.
2. The first resistance line that you
have drawn.
3. Price level where you will move your
line down.
4. The green shaded area highlights the
second resistance level.
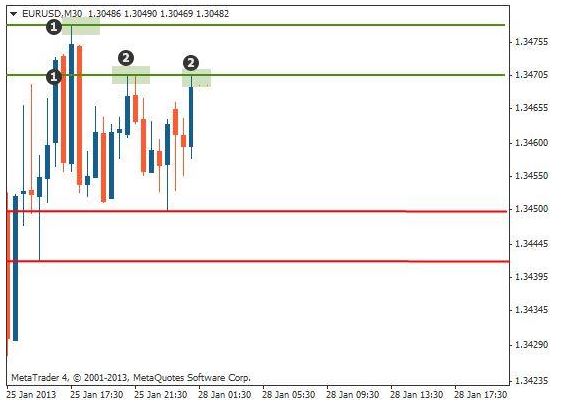
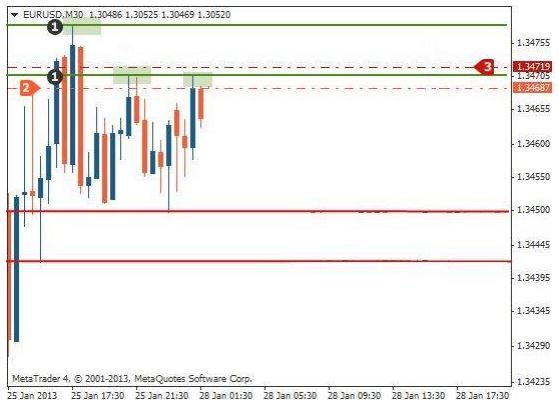
Continue
to place resistance levels on your chart until you reach the current market
price.
You do
not want to put too many resistance levels on your chart – just the most
important ones:
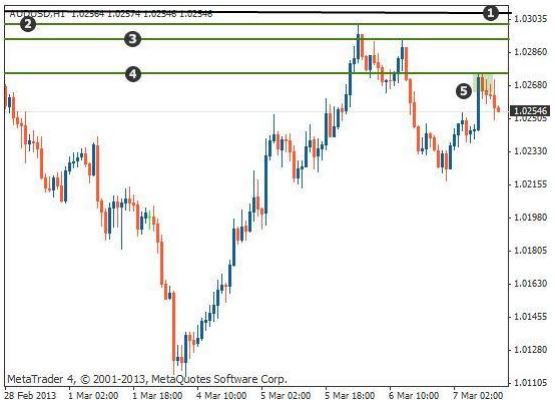
1. Line is drawn at the top of the chart
that you will move down.
2. First resistance line.
3. Second resistance line.
4. Price level you have moved the line
down to.
5. The green shaded area shows the third
resistance level.
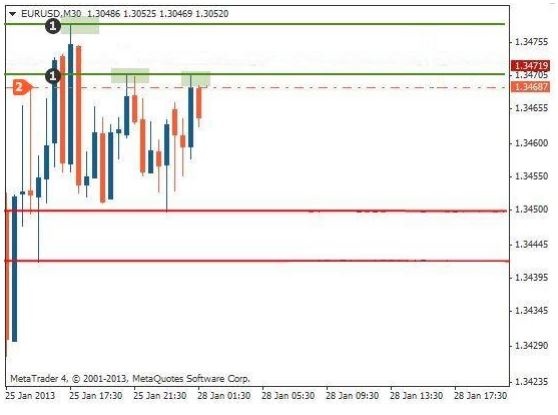
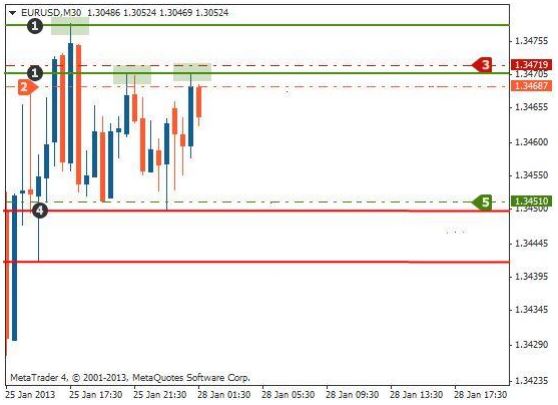
Work your way up from the bottom and place support
levels
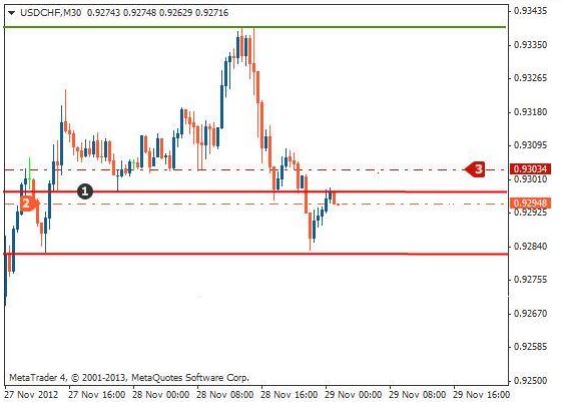
Place a line on the chart and move it up to the
first support level that you find
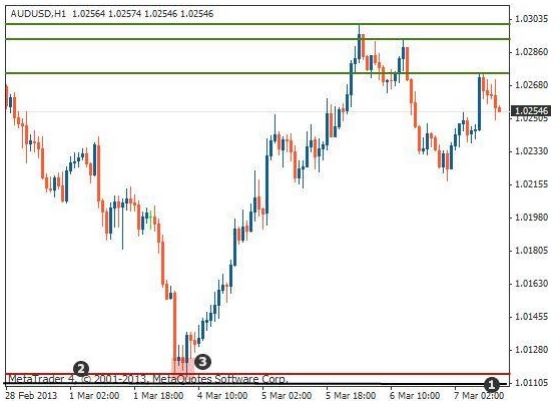
1. Line is drawn at the bottom of the chart
that you will move up.
2. First support level where the line
has been moved up to.
3. Red shaded area shows the first
support level.
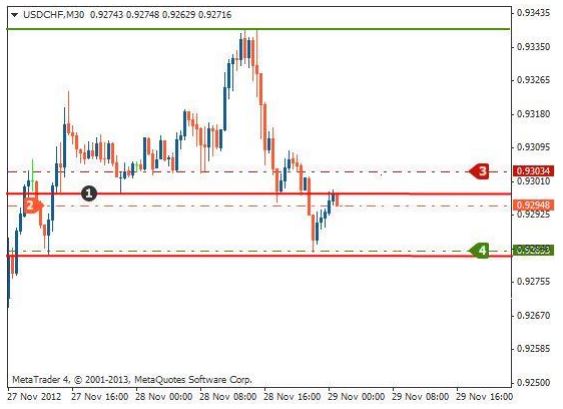
Place another line on the chart and move it up to
the next support level
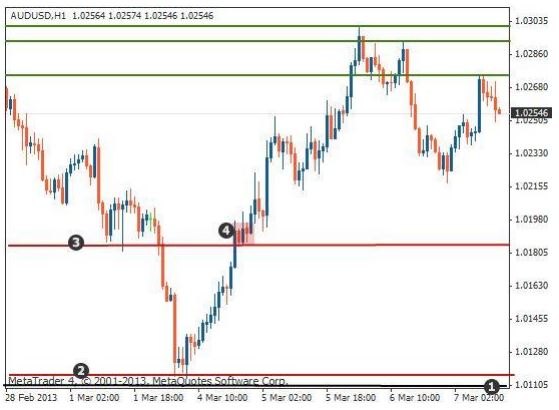
1. New line drawn that you will move up.
2. First support line
3. Second support level where you move
the new line to.
4. Red shaded area shows the second
support level.
Continue to place support levels until you reach
the current market price. You do not want to place too many support levels on
the chart, but rather try to pick the most significant support levels.
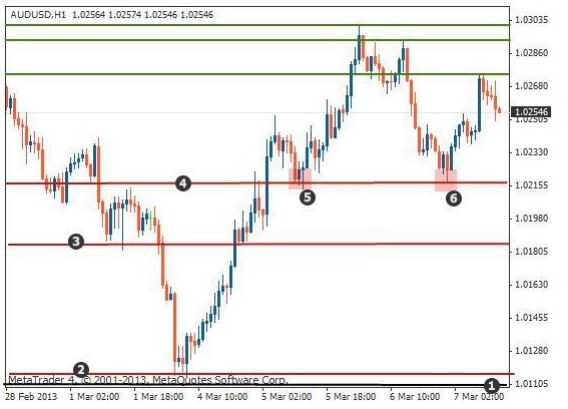
1. New line at the bottom that you will
move up to a new resistance level.
2. First support line.
3. Second support line.
4. Third support level that you will
move the line to.
5 and 6. Red shaded areas show the third support
level.
Once you have finished, you now have a price chart
with a number of support and resistance levels that will look something similar
to the chart above.
Now continue on to the next lesson to learn the
first method of trading with support and resistance levels.
Finding entries at support or
resistance
Now that you have placed your support and
resistance levels, you can now look for possible entries at the support or
resistance levels.
Enter trades at support and
resistance
Look at the price chart and observe the support and
resistance levels that you have drawn on the charts. You will look to place
sell orders at the resistance levels and buy orders at the support levels.
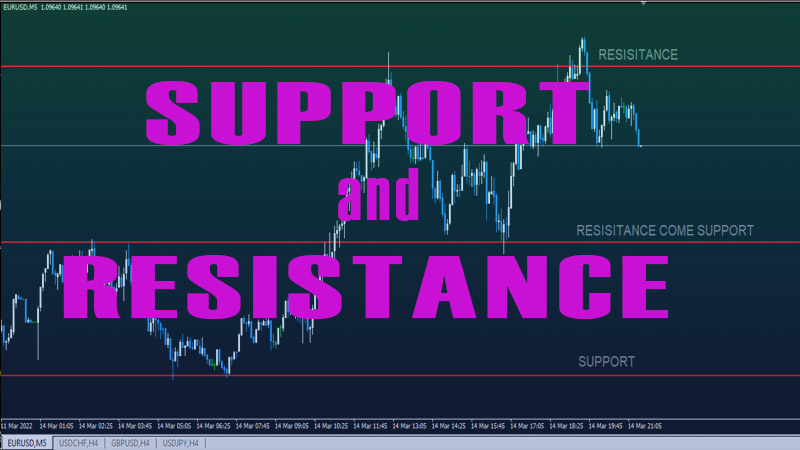
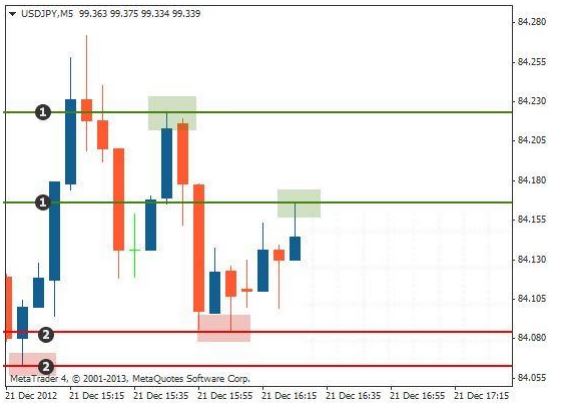
Selling at the resistance levels
Take a look at the following chart – you can see a
number of support and resistance levels:
1. Resistance levels
2. Support levels
The green shaded areas show where the price found
resistance and the red shaded areas show where the price found support.
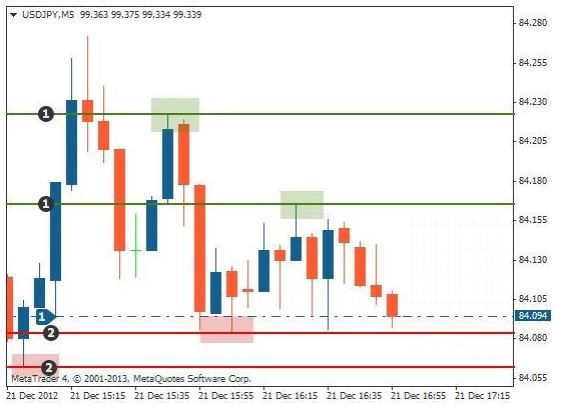
The next step is to wait until the price meets one
of these support or resistance levels.
In the following chart, you can see where the price
has moved up to resistance and has not managed to break above it:
1. Resistance levels.
2. Shaded shows that the price has found
resistance at this level.
Now enter a short (sell) trade after the candle has
closed:
1. Resistance levels
2. Short entry
Place your stop loss on the other side of the resistance
level:
1. Resistance levels
2. Short entry
3. Stop loss
In order to place your profit target, find the next support
level down and place your profit target there:
1. Resistance levels
2. Short entry
3. Stoploss
4. Next support level down
5. Profit target
You should make sure that your reward is bigger than your
risk. It is up to you what your optimal risk to reward should be – ideally you
should have a risk to reward of 1:2 or 1:3.
Buying at support levels
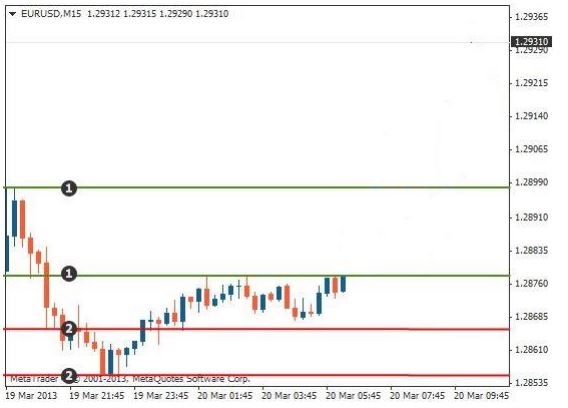
We will now show you an example of buying at support. The
following chart shows a number of support and resistance levels:
1. Resistance levels
2. Support levels
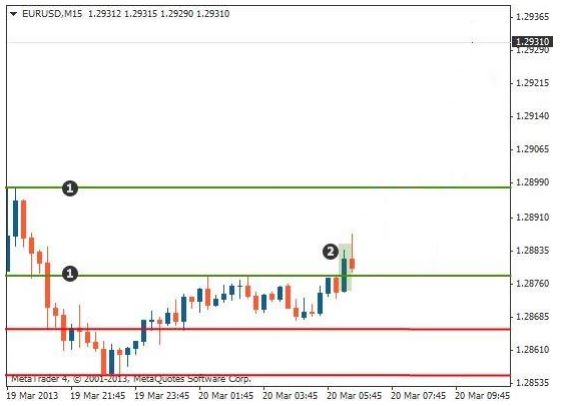
The next step is to wait until the price meets a support
level. In the following chart you can see where the price has come back down to
a support level. You can then enter a long trade:
1. Resistance levels
2. Support levels
1. Long entry at the support level
The stop loss goes just below the support level:
1. Resistance level
2. Support level
1. Long entry at the support level
2. Stop loss below the support line
The profit target goes at the next resistance level up:
1. Resistance levels
2. Support level
1. Long entry after support held
2. Stop loss below the support level
3. Take profit at the next resistance level.
You should make sure that your reward is bigger than your
risk. It is up to you what your optimal risk to reward should be – ideally you
should have a risk to reward of 1:2 or 1:3.
You can go on to learn the second method of trading with support and resistance.
Finding entries using a breakout
This lesson will now show you a second way of trading with
support and resistance levels using what is called 'breakouts' – when the price
breaks through a support or a resistance level.
Trading when the price breaks through support or resistance
This method is different to entering when the price finds
support or resistance. Instead, you wait for the price to break through a
support or resistance level. There are two methods to do this:
1. Trading as soon as the price breaks through a level
2. Waiting for when support becomes resistance or vice
versa.
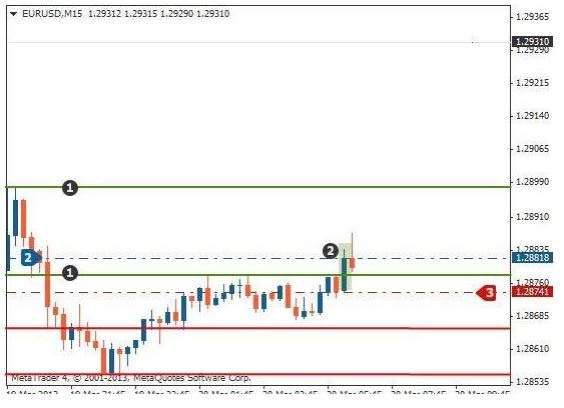
Method One: Enter your trade as soon as the price breaks through
First you identify support and resistance levels on your
chart, as shown on the following chart:
1. Resistance levels
2. Support levels
Wait until a candle either closes above resistance or below
support. In the following chart, you can see that a candle has broken through,
and closed above the resistance level:
1. Resistance level
2. Candle has broken through and closed above the resistance
level.
You can now enter a long trade once the candle as closed.
The stop loss goes below the support level:
1. Resistance level
2. Long entry
3. Stop loss.
In order to determine your profit target, you find the next
support level above your entry as shown in the following chart:
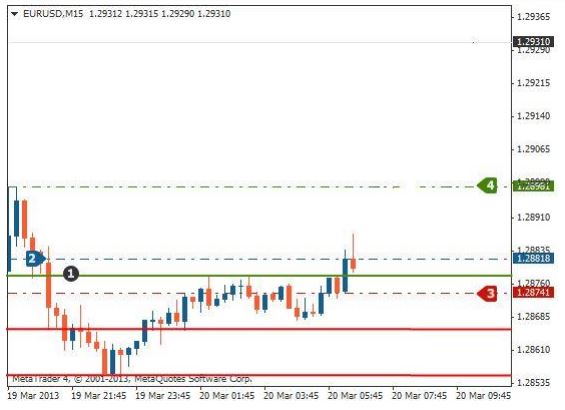
1. Resistance level
2. Long entry
3. Stop loss
4. Profit target
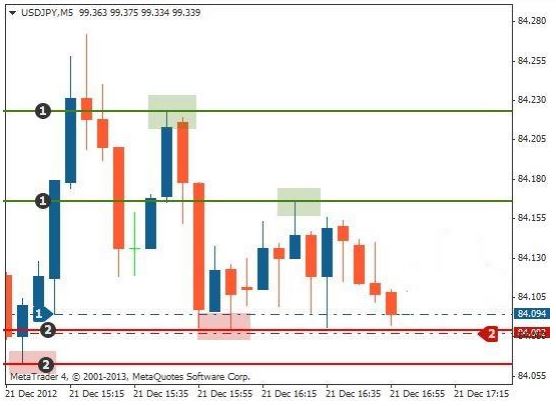
Method two: Waiting for price to come back to support or resistance
Method two is very similar to method one, only instead of
entering as soon as a candle closes above resistance or below support, you
actually wait for the price to come back to the level it broke through. Take a
look at the following chart where you can see a candle breaking below a support
level and closing on the other side:
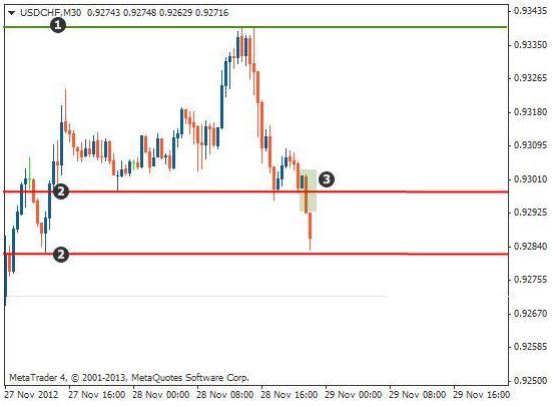
1. Resistance levels
2. Support levels
3. Candle has broken below and closed below the support
level
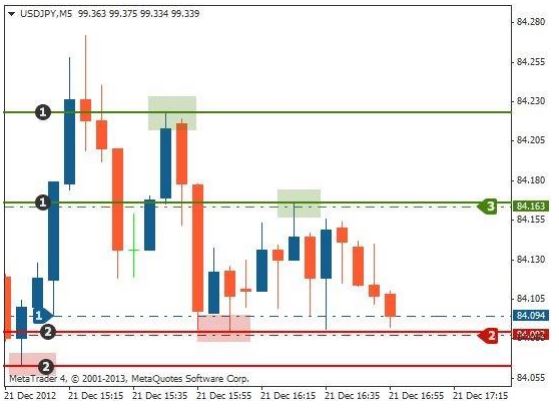
Instead of entering a short trade as soon as the candle as
broken below, you wait for the price to go back to the previous support level
and see if this level now becomes resistance. Take a look at the chart below:
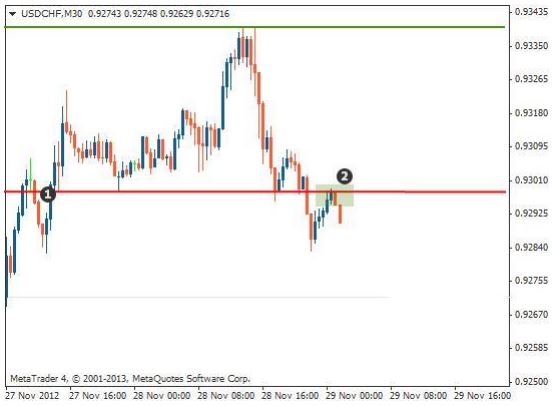
1. Previous support level.
2. Green shaded area shows the previous support level now
acting as resistance.
Once the price has found resistance at the previous support
level, then you enter into a short trade. The stop loss goes above the now
resistance level as shown in the following chart:
1. Support that is now resistance.
2. Short entry after the price found resistance.
3. Stop loss on the other side of the resistance level.
To find your profit target, you then find the next support
level down, as shown in the following chart:
1. Support that is now resistance.
2. Short entry after the price found resistance.
3. Stop loss on the other side of the resistance level.
4. Profit target at the next support level down.
Related Article
·
Support and
· Institutional Concept of Trading
Top Trading Strategy : Tag: Top Trading Strategy, Forex : Find Resistance Levels, Buying at support levels, Selling at the resistance levels - Forex Trading Support and Resistance Strategy – Step by Step Trading Guide