What is Support and Resistance in Forex Trading
Support and Resistance Cheatsheet, Identifying Support & Resistance Levels, How to trade Support and Resistance
Course: [ Top Trading Strategy ]
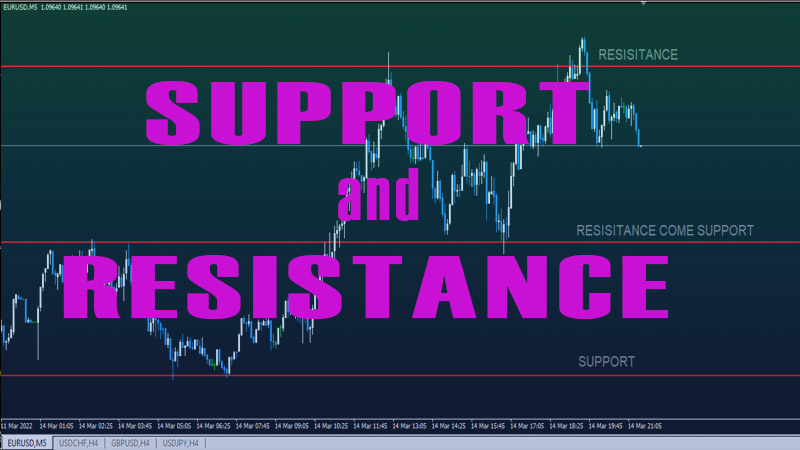
Support and Resistance are horizontal lines, which mark an area of price in which price has previously been rejected at. Price usually repeats what it has done in the past; this is strongly known within the foreign exchange market. The term “history repeats itself” outlines the above.
WHAT IS SUPPORT AND RESISTANCE?
Support and Resistance are horizontal lines, which mark an
area of price in which price has previously been rejected at. Price usually
repeats what it has done in the past; this is strongly known within the foreign
exchange market. The term “history repeats itself” outlines the above.
We use the Monthly, Weekly and Daily timeframes to mark our
support and resistance. The higher the timeframe, the more significant the area
is.
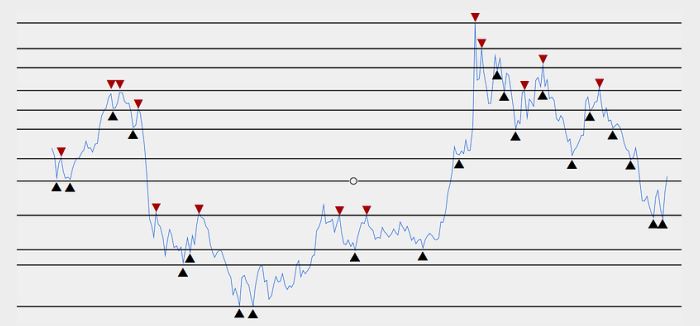
Below is an image of a Downtrend using Support and Resistance
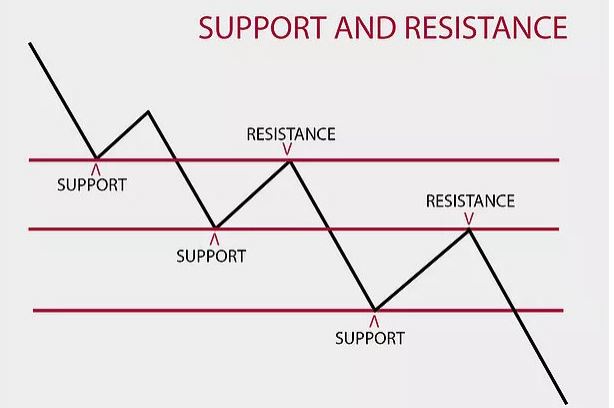
As you
can see from the image above, as the market is moving in a downwards direction
putting in lower highs and lower lows, it uses support and resistance as levels
to be rejected at.
A
support level is where you could see Bullish Price Action, and at a resistance
level is where you could find Bearish Price Action to show continuation of the
downside move.
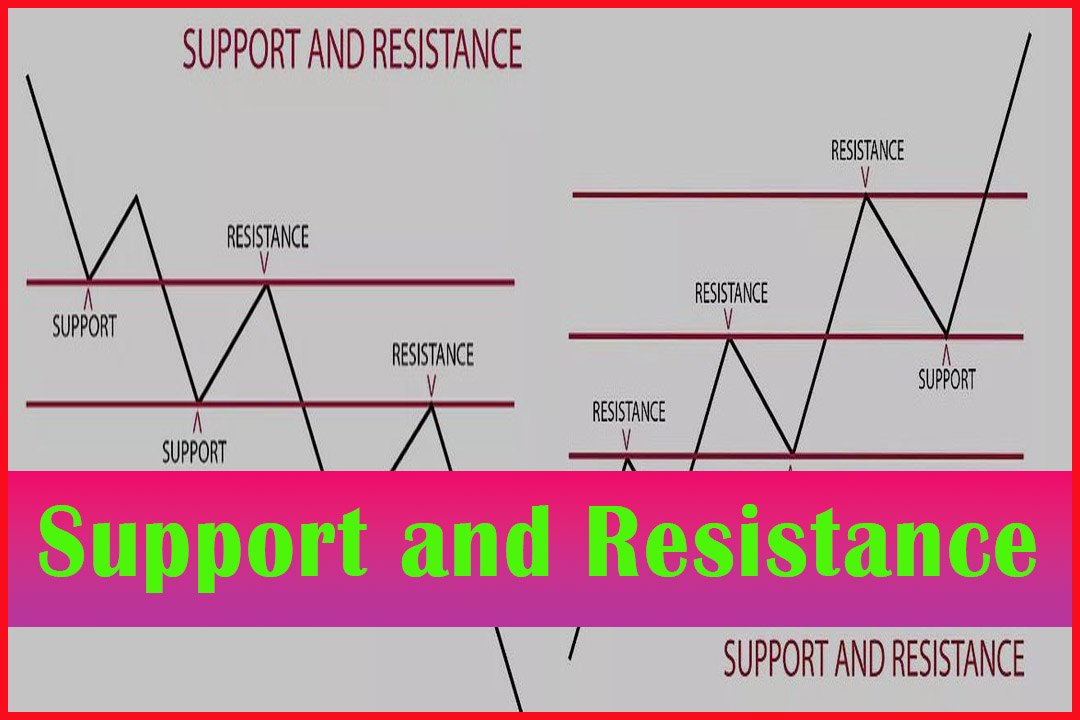
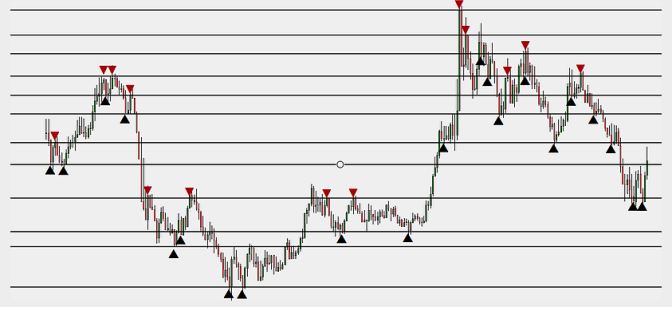
Below is an image of an Uptrend using Support and Resistance
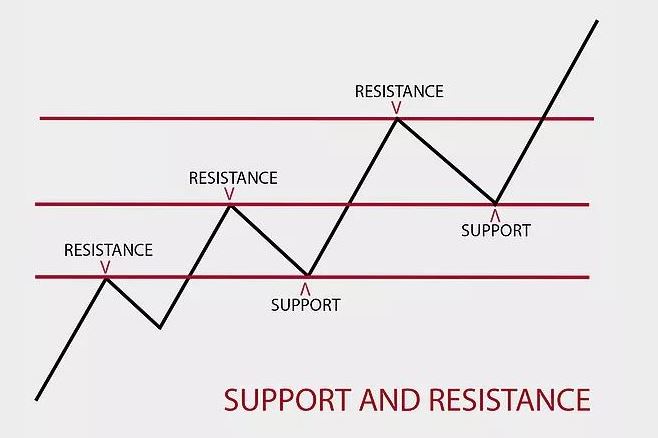
As you
can see from the image above, as the market is moving in an upwards direction
putting in higher highs and higher lows, it uses support and resistance as
levels to be rejected at.
A
Resistance level is where you could see Bearish Price Action, and at a support
level is where you could see Bullish Price Action to show continuation of the
upside move.
HOW DO I DRAW MY SUPPORT AND RESISTANCE?
To draw
our Support and Resistance lines we use the LINE CHART on the Monthly, Weekly
and Daily charts.
As stated
previously, the higher the time frame the more significant the level.
Below
is a step by step of how to draw Support and Resistance lines
Firstly
we will show you how to select the horizontal line tool on Trading View:
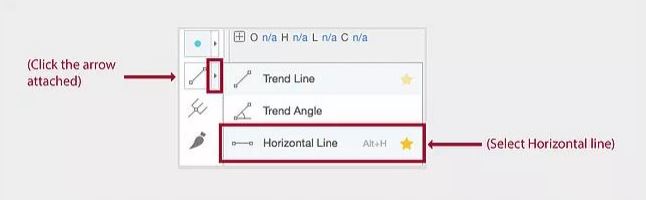
Now you
know how to select the horizontal line tool on trading view, we are going to
plot our monthly, support and resistance.
To plot
your monthly support and resistance lines, you are looking for the horizontal
areas that have the most significant rejections or bounces.
Below
is the monthly chart of EUR/GBP:
As you
can see we have marked on our support and resistance levels.
we have
also highlighted the points of rejection to indicate to you why we have
selected each level.
As you
can see we have marked on our support and resistance levels.
We have
also highlighted the points of rejection to indicate to you why we have
selected each level.
Below
is the candle stick version of the above EUR/GBP monthly chart
As you
can see from the areas we have marked using the line chart, they align with the
candle chart. You are able to use either depending what you are more
comfortable with. We recommend starting with the line chart.
Now we
change down a timeframe to the weekly.
We
leave the monthly support and resistance in place and mark our significant
weekly levels. When changing down a timeframe this can also allow you to
slightly adjust your monthly levels, if you can see it needs to be adjusted to
be closer to the area of previous rejection.
Below
is our EUR/GBP weekly chart, with our weekly and monthly support and resistance
When
marking our weekly support and resistance, we prefer to use a different colour
of line so we know the difference.
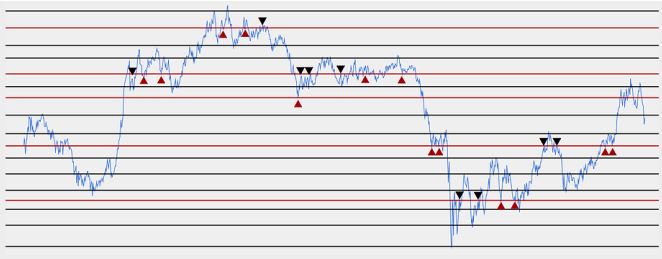
As you
can see from the areas we have marked on the monthly timeframe, they align on
the weekly. We have marked out significant weekly areas of support and
resistance in red. We have also highlighted the points of rejection to indicate
why we selected each level.
If you
would like to check or use the candle chart, that is not an issue, however we
do recommend sticking to the line chart for your support and resistance. Now we
change down a timeframe to the daily.
We
leave the monthly and weekly, support and resistance in place and mark our
significant daily levels if necessary.
When
looking for daily support and resistance levels, you are looking around current
price for any significant rejection points. Sometimes there may not be any
daily levels, due to your monthly and weekly levels already covering all
necessary areas.
Below
is our EUR/GBP daily chart, with our monthly and weekly support and resistance
When
marking our daily support and resistance, we prefer to use a different colour
of line so we know the difference.
As you
can see from the areas we have marked on the monthly and weekly timeframe, they
align on the daily timeframe.
We have
marked out significant daily areas of support and resistance in dashed orange.
We have
also highlighted the points of rejection to indicate why we selected each
level.
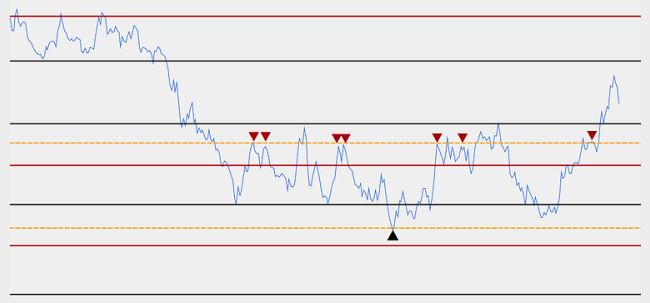
Now
lets take a look at our candlestick chart with all our support and resistance
levels marked on the chart
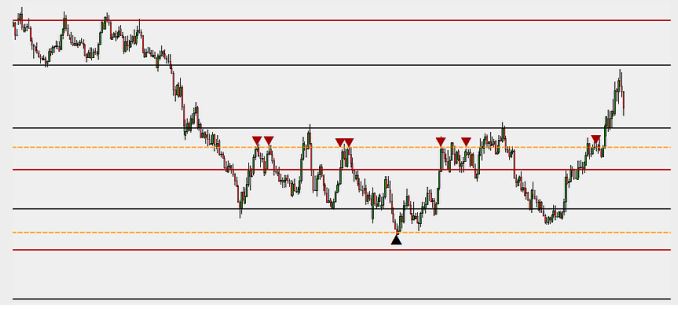
As you
can see from the areas we have marked on the monthly, weekly and daily
timeframes , they show nice clean price rejection areas.
This
shows us that we have marked our support and resistance levels correctly, as we
can see we have a nice clear view of our monthly, weekly and daily rejection
points.
Always
remember the higher the timeframe, the more significant the level of rejection
is. This is why we use different coloured lines to mark our levels, so always
remember what levels are which.
WHAT IS SUPPORT AND
RESISTANCE TO REJECTION?
Support and Resistance Rejection is when price forms a reversal candlestick at a significant level. For price to reject a support level you would need to see a BULLISH REVERSAL CANDLESTICK FORM.
For
price to reject a resistance level you would need to see a BEARISH
REVERSAL CANDLESTICK FORM.
Below
is examples of price rejecting resistance levels: (All examples taken from our
above EUR/GBP chart)
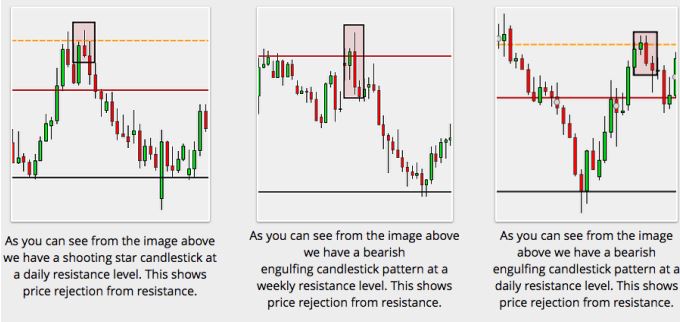
NOW LETS TAKE A LOOK AT SUPPORT REJECTION
Below
is examples of price rejecting support levels: (All examples taken from our
above EUR/GBP chart)
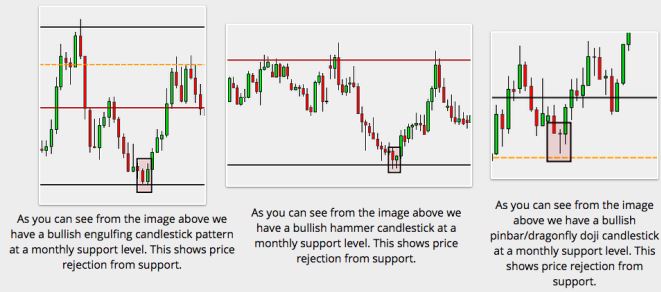
ALWAYS REMEMBER WITHIN AN UPTREND YOU WANT TO BE BUYING
FROM SUPPORT REJECTIONS!
AND WITHIN A DOWNTREND YOU WANT TO BE SELLING AT RESISTANCE
REJECTIONS!
Related Articles
·
What is Price Action
Trading | Important Key points
·
Every Traders Must
Know 13 Chart Pattern in Forex Trading
·
Supply and Demand MT4
Indicator Download
· How to trade Supply & Demand Strategy – Price Action trading
Top Trading Strategy : Tag: Top Trading Strategy, Forex : Support and Resistance Cheatsheet, Identifying Support & Resistance Levels, How to trade Support and Resistance - What is Support and Resistance in Forex Trading