How to use Bollinger Bands
How to use Bollinger Bands | High profit trading strategy | Bitcoin trading Startegy | Cryptocurrency trading strategy
Course: [ Top Trading Strategy ]
Bollinger bands are envelopes that surround the currency prices on a chart. Envelopes are simply symmetrical lines parallel to a moving average, where the moving average is the centre of the trend, and the envelope consists of the points of maximum and minimum divergence from it. Bollinger bands is a popular method of interpreting the moving average concept.
Bollinger Bands
A Form of Envelopes
Bollinger
Bands are envelopes that surround the currency prices on a chart. Envelopes are
simply symmetrical lines parallel to a moving average, where the moving average
is the centre of the trend, and the envelope consists of the points of maximum
and minimum divergence from it. Bollinger band is a popular method of
interpreting the moving average concept.
The Gist of Bollinger Bands
Bollinger
bands are calculated as standard deviations above and below a moving average,
commonly set to 20. Since the standard deviation is a measure of volatility.
the Bollinger bands adjust themselves to market conditions. The banks widen as
the price trend becomes more volatile, and narrow during less volatile periods.
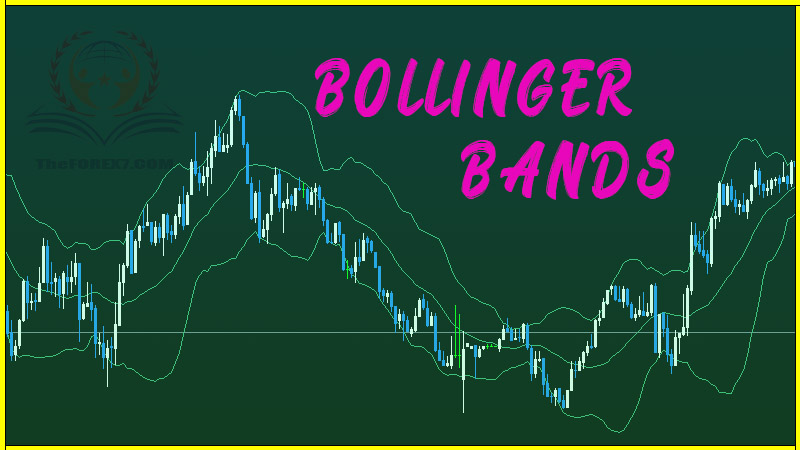
Figure
1 shows an hourly chart of USD/JPY, with the green band as the upper Bollinger
band, the yellow band as the lower Bollinger band, and the middle purple line
as the 20-moving average.
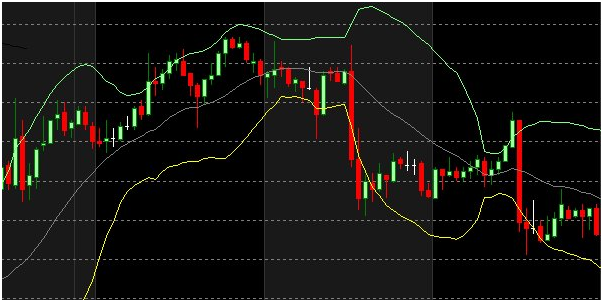 Figure 1
When
the bands contract, it signals a period of low volatility, whereby demand and
supply are in a fine state of balance, and neither bulls nor bears are in
charge. Narrowing signals a tendency for sharp price movements to follow. If
the price breaks out of a band, the trend is expected to continue.
When
the price exceeds the upper band, it means the upside momentum is strong enough
to support higher prices, and the same is true for a price breakout of the
lower band. Very often, the currency price will cross back into the envelope,
and this crossover signals short-term exhaustion before the trend continues
again. Sometimes, the price will crossover for the last time before the trend
reverses.
One
way of spotting a possible trend reversal is when the currency pair tries
several times in attempting to break out of the upper or lower band but fails,
and in the process, forms a reversal chart pattern, such as a Double Top or
Bottom. The added weight of evidence seeks to alert the trader of a potential
reversal ahead.
How to Use Bollinger Bands in Currency Charts
Bollinger
bands do not generate buy and sell signals alone. They should be combined with
other technical indicators such as MACD or price patterns to give a better
overall technical picture of the currency pair.
Bollinger
bands do not work well during trending phrases, just like momentum indicators.
If you look at Figure 2, you see that when the trend moves persistently in one
direction, which in this case is a downtrend, touching the lower band does not
offer a timely signal because the band progressively turns lower together with
the price declines.
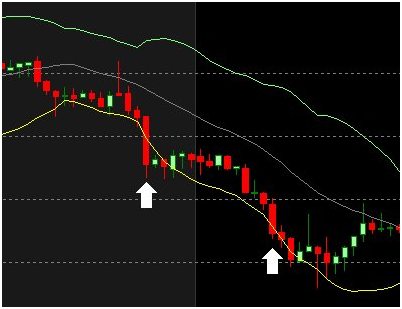
Figure 2
If
you have other technical indications of a currency price trend, it is possible
to use the bands as areas to enter the trend. For example, if technical indicators
and market sentiment favor a downtrend, you may enter a short position when the
price moves to the upper Bollinger band, as shown in the hourly chart of
USD/JPY in Figure 3. Note that the sloping down of MACD at the bottom of Figure
3 indicates that a downtrend is in place.
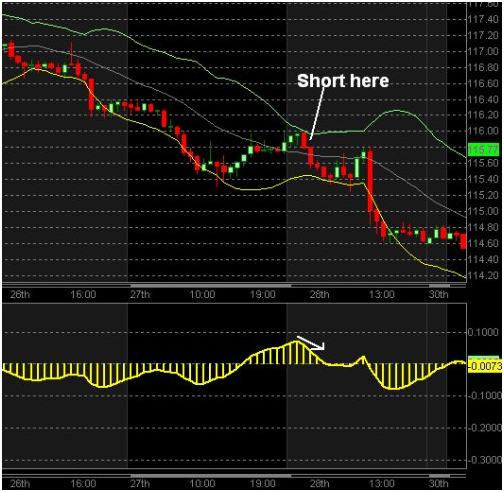
Figure 3
As
mentioned earlier, after the currency price has broken out of a band, it will
soon cross back into the envelope, and this crossover very often signals a
short-term pause in the trend, as opposed to a trend reversal. As such, it may
be a good idea to take profits when the price moves back into the band after
breaking out earlier on.
Figure
4 shows the price has broken out of the upper Bollinger band in an hourly chart
of USD/JPY, and MACD is sloping upward at the same time. It may be a good place
to take a profit when the price falls back into the band again, as indicated by
the arrow.
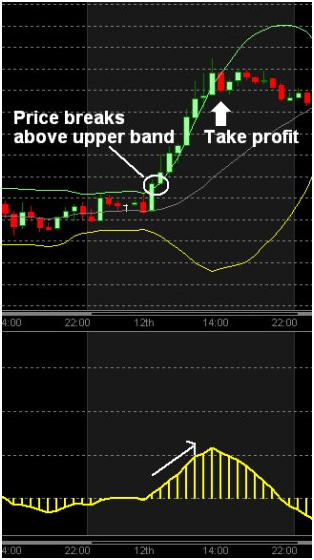
Figure 4
Trading Tips
·
It is not
advisable to use Bollinger Bands on their own; that is, for generating sell
signals when the currency price approaches the upper band, and buy signals when
the price approaches the lower bands.
·
The bands may
be used as areas to enter a trend based on trend-following indicators.
·
Combine
Bollinger bands together with other chart patterns like Double Top or Bottom or
divergence signals from momentum indicators if you want to use them for
reversal entry levels.
Top Trading Strategy : Tag: Top Trading Strategy, Forex : How to use Bollinger Bands | High profit trading strategy | Bitcoin trading Startegy | Cryptocurrency trading strategy - How to use Bollinger Bands