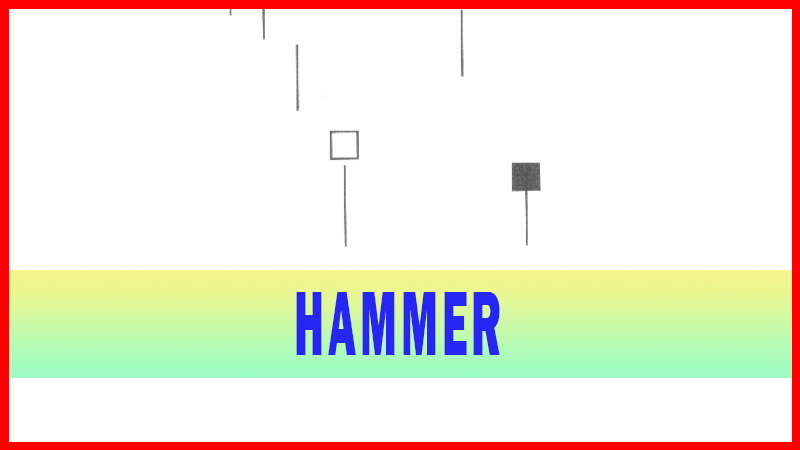
Dark Cloud Cover
Piercing pattern, Bearish Engulfing signal, Candlestick sell signal, Dark Cloud signal, Reversal signal
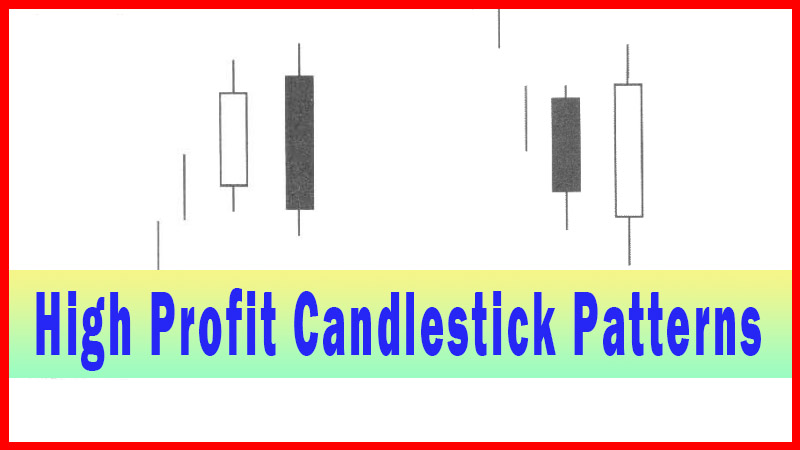
Course: [ How To make High Profit In Candlestick Patterns : Chapter 1. The Major Candlestick Signals ]
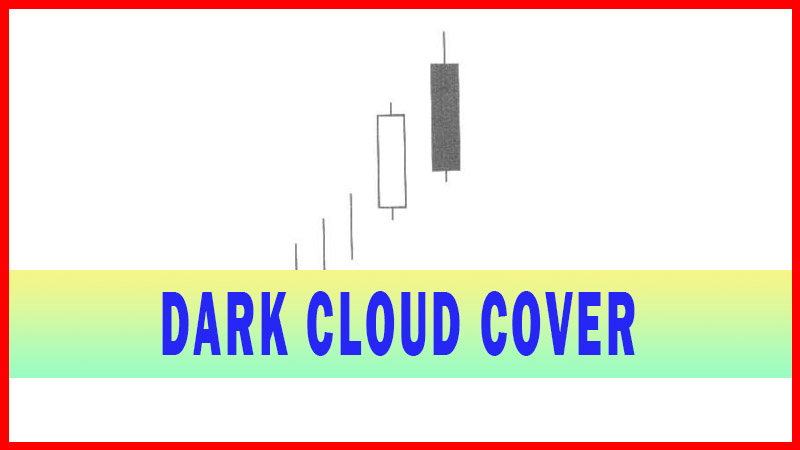
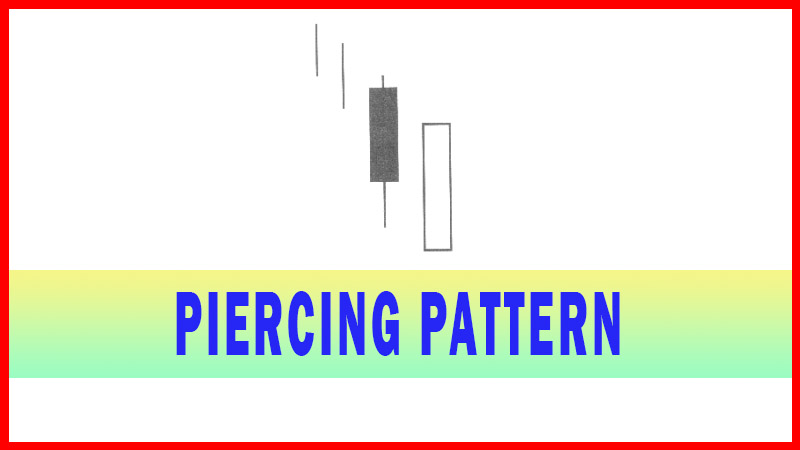
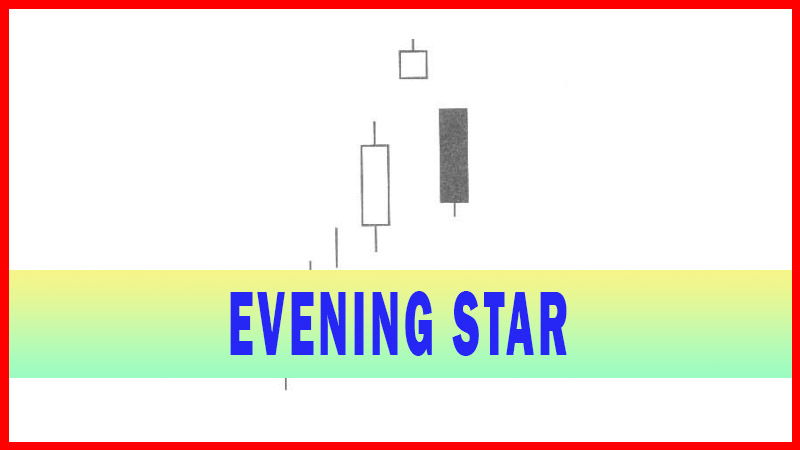
The Dark Cloud Cover is the bearish counterpart to the Piercing pattern. It gets its name from the ominous dark candle that is formed after a nice bright uptrend. The first day of the pattern is a long white candle at the top end of a trend.
DARK CLOUD COVER(Kabuse)
Description
The Dark
Cloud Cover is the bearish counterpart to the Piercing pattern. It gets its
name from the ominous dark candle that is formed after a nice bright uptrend.
The first day of the pattern is a long white candle at the top end of a trend.
The second day’s open price is higher than the high of the previous day. It
closes at least one-half the way down the previous day’s candle. The further
down the white candle, the more convincing the reversal. ‘Kabuse’ means to get
covered or to hang over.
The
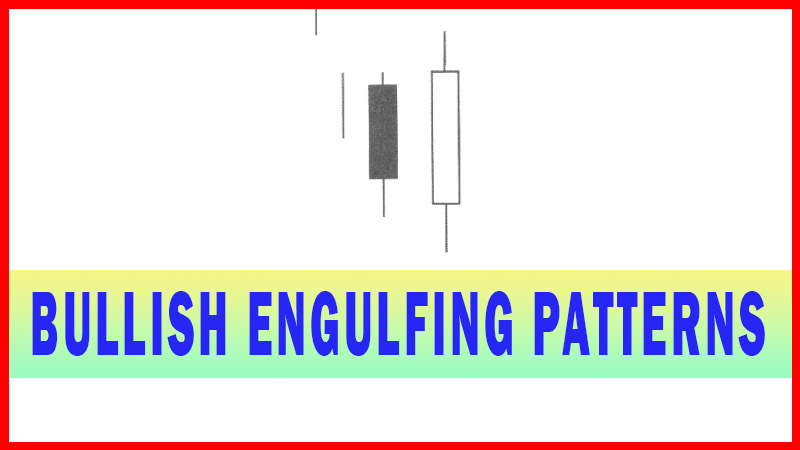
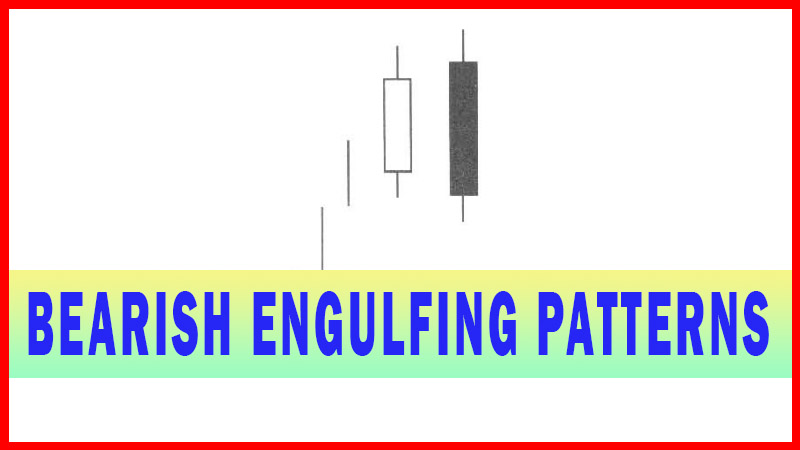
Piercing Pattern has almost the same characteristics as a bullish engulfing
signal. Likewise, the Dark Cloud signal has almost the same characteristics as
the Bearish Engulfing signal. The difference is that a Dark Cloud is formed as
it opens higher than not only the previous day’s close of the white candle, but
it gaps up above any of the previous day’s trading range.
The gap
up becomes the first alert indicating that a candlestick sell signal is in the
making. The exuberant buying at the top should be viewed with suspicion. Once the
selling has occurred, it continues into the close. As the Piercing Signal
requires a close more than halfway up into the previous day’s black candle, a
Dark Cloud signal requires a close below the halfway point of the last white
candle. The same parameters enhance the credibility of a Dark Cloud as seen in
the Piercing signal. The higher the gap-up open, the higher the probability a
downtrend is in progress and the greater the potential force of the downtrend.
The further the close comes below the midway point of the previous day’s
candle, the stronger the downward trend should be. Once again, like the
Piercing Signal parameter, a Dark Cloud signal requires a close below more than
the midway point of the previous bullish candle.
Criteria
1.
The body of the first candle is
white; the body of the second candle is black.
2.
The up-trend has been evident for
a good period. A long white candle occurs at the top of the trend.
3.
The second day opens higher than
the trading of the prior day.
4.
The black candle closes more than
half-way down the white candle.
Signal Enhancements
1.
The longer the white candle and
the black candle, the more forceful the reversal.
2.
The higher the gap up from the
previous day’s close, the more pronounced the reversal.
3.
The lower the black candle closes
into the white candle, the stronger the reversal.
4.
Increased volume during these two
trading days is a significant confirmation.
A Dark
Cloud signal is not difficult to spot. Keep in mind the very simple rules that
established a Dark Cloud signal. A gap up above the previous day’s trading and
closing well into the last bullish candle forms a signal that clearly indicates
an uptrend is over.
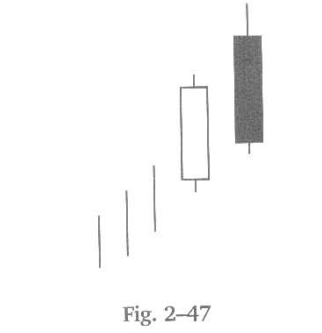
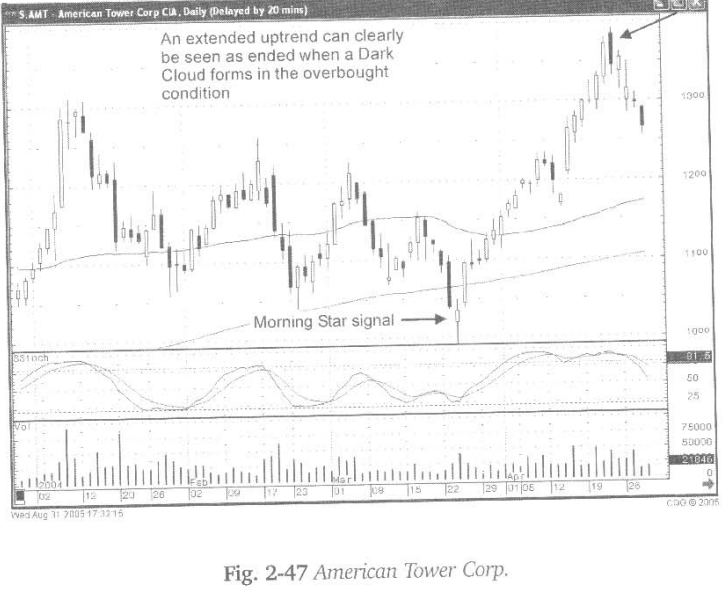
Fig.
2-47, The American Tower Corp. chart has a nice uptrend in progress for a month
and a half. It started at a major moving average with a Morning Star signal.
The top was clearly illustrated with a dark candle that showed a change of
investor sentiment.
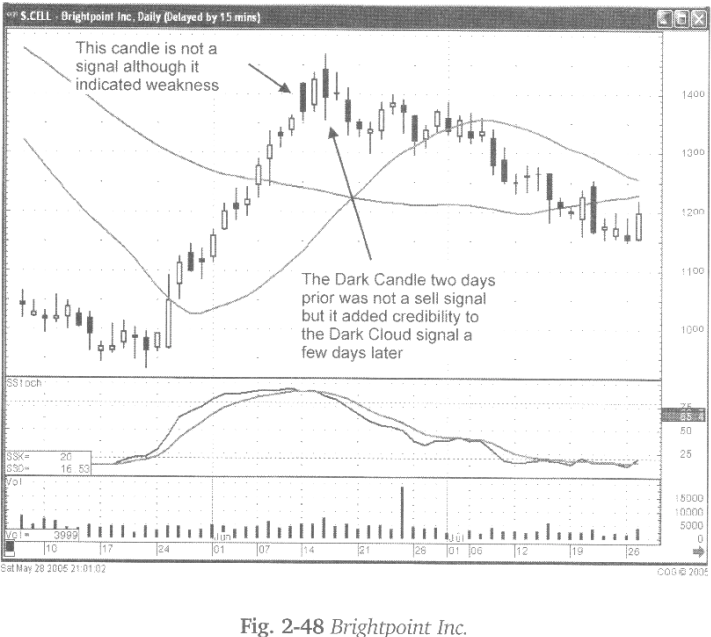
The trends
in Fig. 2-48, the Brightpoint Inc. chart showed signs of weakness in mid-June
with a bearish candle. However, that bearish candle was not a reversal signal.
When the Dark Cloud signal was formed a couple days later, the fact that some
weakness had occurred a few days prior made the Dark Cloud signal that much
more significant. Although all candle formations are not signals, the
interpretation of surrounding candles in overbought or oversold conditions can
add credibility to the actual candlestick signal when it is formed.
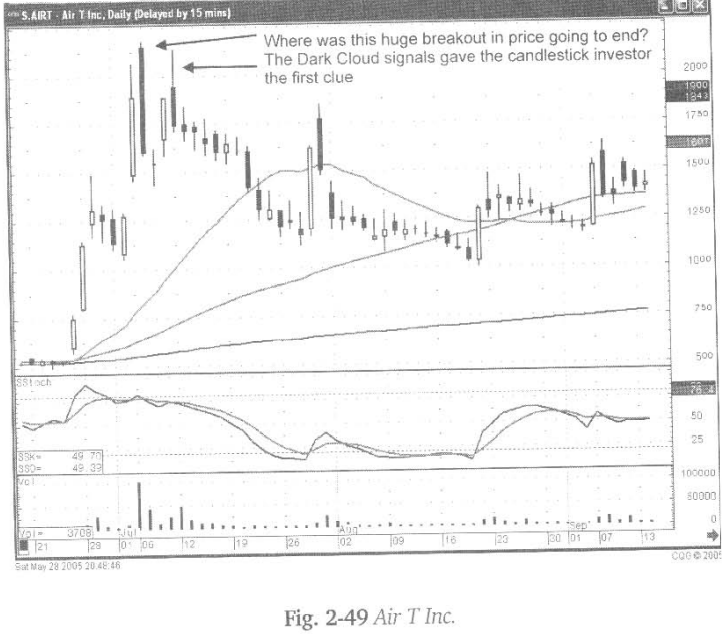
Notice
how the Dark Cloud formed twice in Fig. 2-49, the AirT Inc. chart. The first
Dark Cloud signal produced a very good indication that the breakout in price
was now over. A few days later the second attempt to take the price of the
stock back up was also stifled by the appearance of a second Dark Cloud. Simple
visual observation, observing two Dark Cloud signals, in close proximity of
each other, should have made it apparent that the sellers had stopped the
uptrend.
Use the
dark candle signal to prepare to take profits or be ready to establish short
positions. The Dark Cloud signal lives up to its name. It does cast a dark
cloud over nice up-trends. What other investors are ‘hoping’ for, a continued
upward move in prices, the candlestick investor can visually evaluate. The
probabilities an uptrend is over when a Dark Cloud signal forms, takes the
emotion out of an investment decision.
How To make High Profit In Candlestick Patterns : Chapter 1. The Major Candlestick Signals : Tag: Candlestick Pattern Trading, Forex : Piercing pattern, Bearish Engulfing signal, Candlestick sell signal, Dark Cloud signal, Reversal signal - Dark Cloud Cover