Hammer Pattern
Hammer pattern, Reversal pattern, Hammer signal, Best Trading Pattern
Course: [ How To make High Profit In Candlestick Patterns : Chapter 1. The Major Candlestick Signals ]
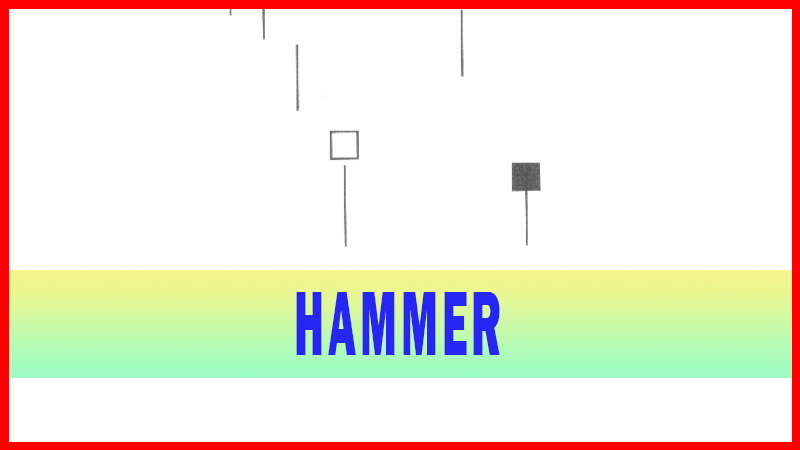
The Hammer signal is aptly named. It looks like a hammer. The Hammer is comprised of one candle. It has one defining feature. The extensive shadow or mil to the downside!
HAMMER
Description
The
Hammer signal is aptly named. It looks like a hammer. The Hammer is comprised
of one candle. It has one defining feature. The extensive shadow or mil to the
downside!
Found at
the bottom of a downtrend, this signal shows evidence the Bulls started to step
in. The signal is usually formed after an extensive downtrend has been in
effect. The price opens and continues to head down. However, before the end of
the day, the Bulls start moving in.
One of
the few formulas that an investor has to learn when analyzing candlestick
signals is the length of the “shadow” or “tail.” In the case of a Hammer signal, the lower
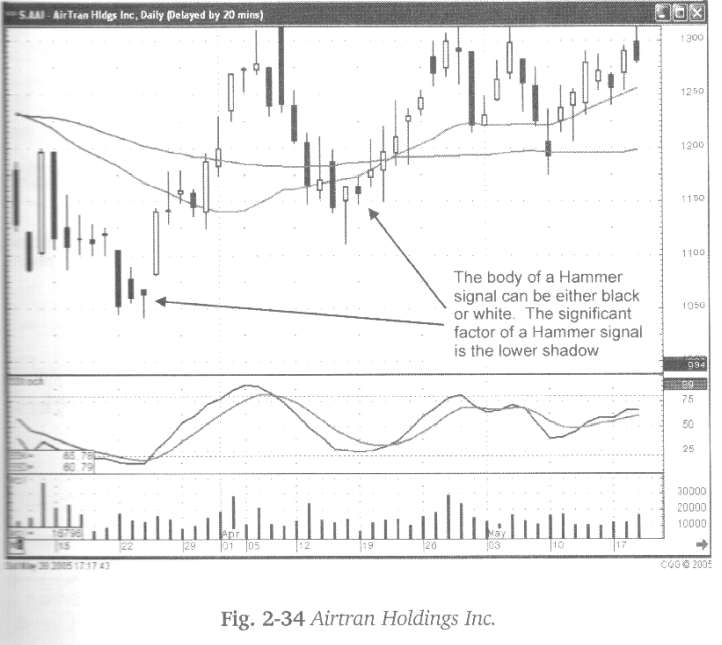
shadow or tail should be at least two times greater than the body. The body can
be either black or white. When viewed in the oversold condition, one should
watch for a bullish confirmation the following day.
The
important aspect of a Hammer signal illustrates that the Bears were pushing the
prices down. Then the Bulls started entering the trade. The Japanese say, “The Bears were hammering out the bottom.”
The term “takuri” in
Japanese is defined as “searching or
probing for the depths,” testing
for the bottom.
The
strength in which the Bulls started coming into the position is depicted by
the color of the body. The buyers stepping in at the bottom of a trend,
bringing the price back up into the top third of the trading range for the day
is illustrated as a hammer signal with a black body. The significance of this
signal is that the Bulls have moved in.
Criteria
1.
The lower shadow should be at
least two times the length of the body.
2.
The real body is at the upper end
of the trading range. The color of the body is not important although a white
body should have slightly more bullish implications.
3.
There should be no upper shadow
or a very small upper shadow.
4.
The following day needs to
confirm the Hammer signal with a strong bullish day.
Signal Enhancements
1.
The longer the lower shadow, the
higher the potential of a reversal occurring.
2.
A gap down from the previous
day’s close sets up for a stronger reversal move, provided the day after the
Hammer signal opens higher.
3.
Large volume on the Hammer Day
increases the chances that a blow-off day has occurred. (Blow-off day – see
glossary)
The
signal gains more strength if the Bulls bring the price back up through the
open and close at or above that price, creating a white body. This illustrates
more strength coming from the buyers than a black body.
What do
investors want to see after a Hammer signal? Continued buying! Does that
continued buying need to come in the next day? Not necessarily As will be
experienced with many candlestick reversal signals appearing at the end of a downtrend,
residual selling may occur for another day or two before a trend starts its
move. The reversal signal indicates a change of investor sentiment. The trend,
from that point, has a high probability of moving in an upward direction.
However, it may take another few days to soak up the remainder of the sellers.
As illustrated in Fig. 2-35 (following page), the AMB Properties chart, the
large shadow to the downside is the clear reversal of the trend.
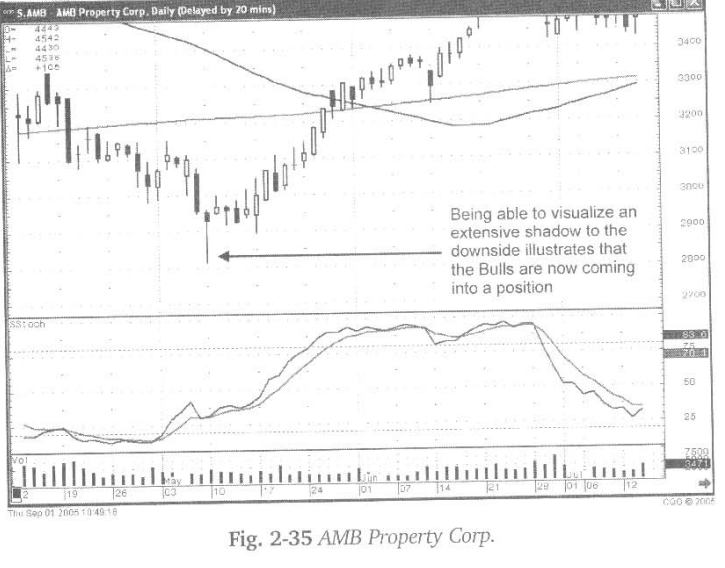
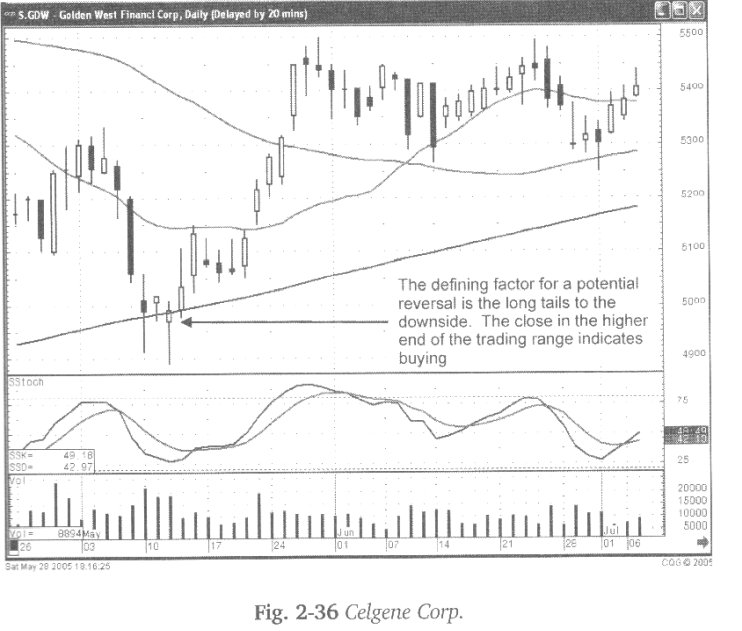
Fig.
2-36, the Celgene Corp. chart shows how one signal might have multiple names.
The hammer signal could also be considered a Bullish Harami. The length of the
shadow is an important indicator in itself. The further the prices were knocked
down and then bought back, the more convincing the reversal.
The name
of the signal is less important than being able to identify that a reversal
signal has formed. The long lower-shadow, forming a Hammer signal, at a major
moving average, while the stochastics are in an oversold condition, are the parameters
aligning for a high probability trade.
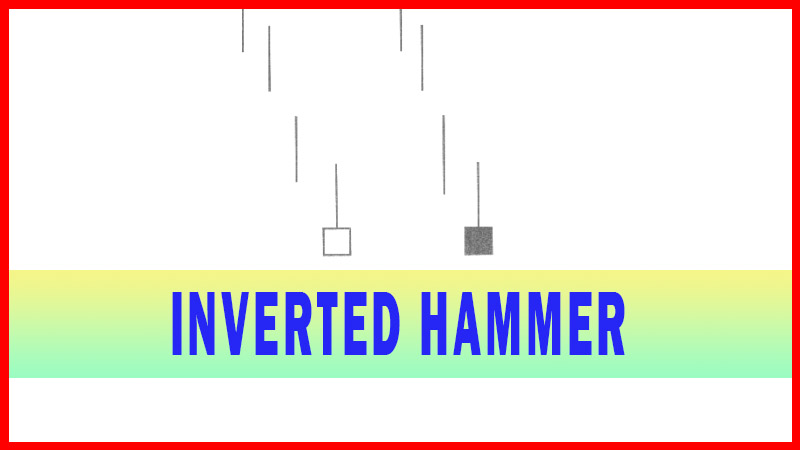
The true
Hammer signal is depicted with no upper shadow or a very small upper shadow
above the body. The evaluation of whether a Hammer signal is a true Hammer
signal, a Spinning Top, or a Dragonfly Doji is not highly relevant
The
importance of evaluating the signal is to discern whether the signal
demonstrates a reversal possibility.
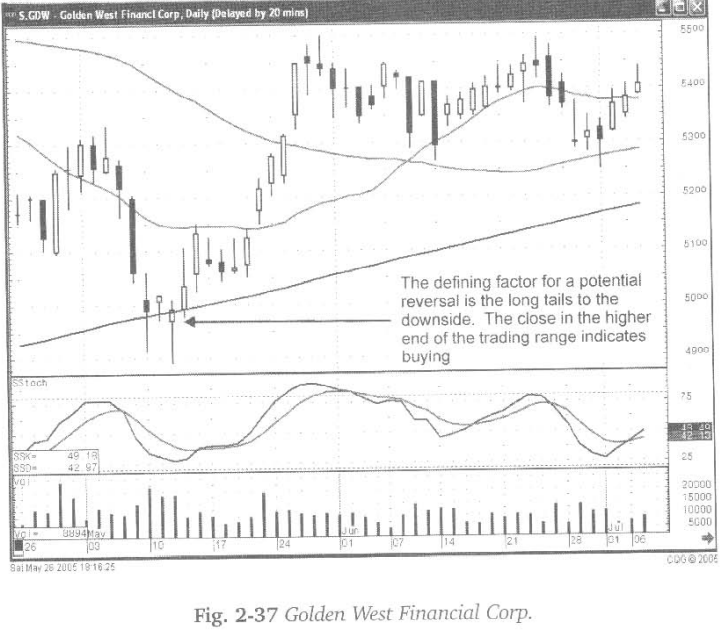
As
witnessed in Fig. 2-37, the Golden West Financial Corp. chart, a long shadow to
the downside provides the indication that a reversal possibility is in the
making.
The
actual description of the signal is much less important than evaluating what
the formation is conveying. In addition, the analysis should include the
condition of the stochastics and the presence of a major moving average. However,
the most foretelling attribute, the long lower shadow, should be the main
consideration.
The
defining element of a Hammer signal is the shadow to the downside. It
illustrates that when the Bears knocked the price down, the Bulls stepped in.
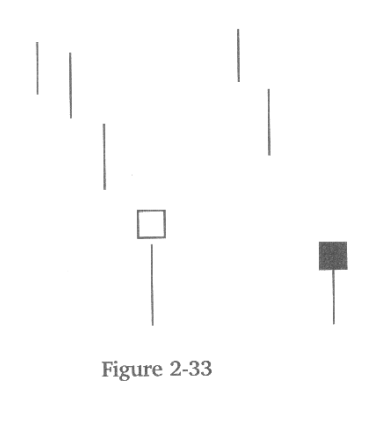
That same analysis can be better defined when witnessing a series of Hammer
signals. Those signals produce a visual scenario that demonstrates the Bears
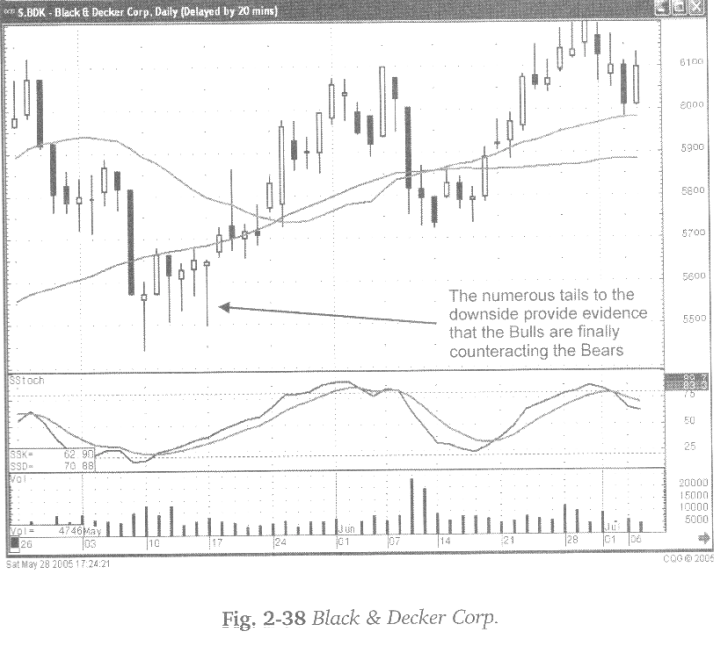
are running out of steam. As illustrated in Fig. 2-38 the Black & Decker
Corp. chart, a number of Hammers occurring as stochastics start rising
illustrates that the Bulls are buying each time the Bears are trying to sell.
The shadows to the downside make it clear for the candlestick investor to
visualize buying support. An uptrend should be anticipated. A bullish candle,
coming out of this type of trading area, should reveal immediately that the
Bears have given up.
How To make High Profit In Candlestick Patterns : Chapter 1. The Major Candlestick Signals : Tag: Candlestick Pattern Trading, Forex : Hammer pattern, Reversal pattern, Hammer signal, Best Trading Pattern - Hammer Pattern