Hanging Man
Hanging Man Pattern, Hammer signal, Hanging Man signal, Best Reversal pattern
Course: [ How To make High Profit In Candlestick Patterns : Chapter 1. The Major Candlestick Signals ]
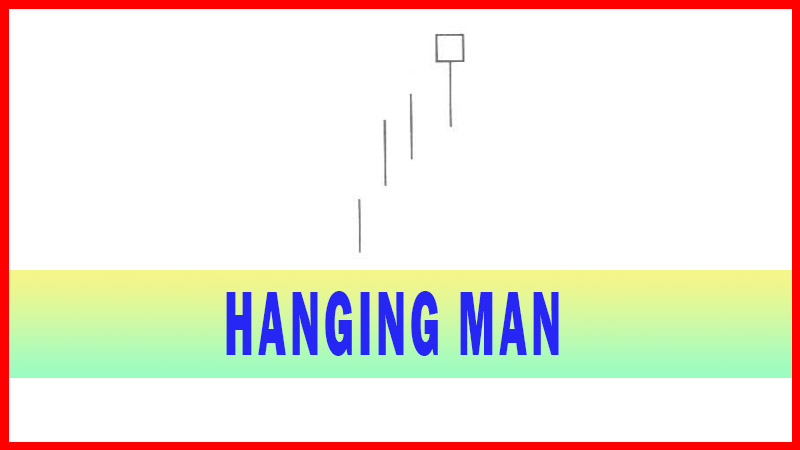
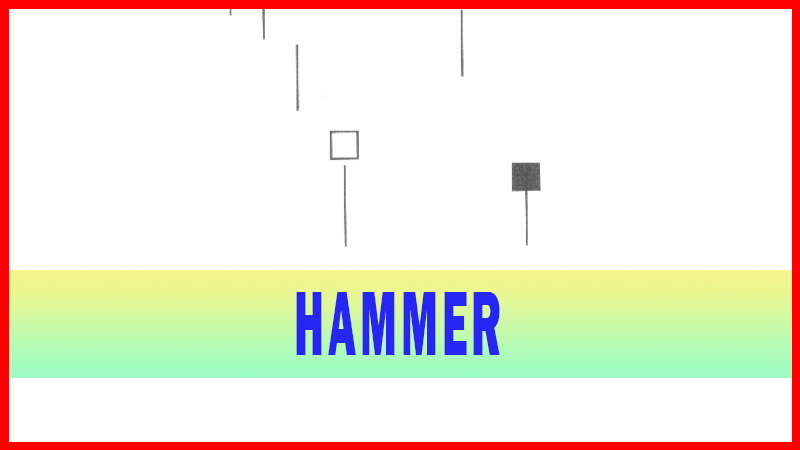
The Hanging-Man and the Hammer signal have the same characteristics but the Hanging Man is found at the top of a trend while the Hammer is found at the bottom of a trend.
HANGING MAN Paper Umbrella (Karakasa)
Description
The
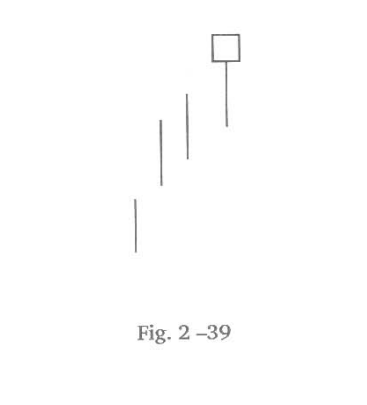
Hanging Man is comprised of one candle. It requires a lower tail two times greater
than the body. Its name is derived by the Japanese; explaining it looks like a
hanging man. The body is the head and the tail is the dangling feet. The Hanging-Man and the Hammer signal have the same
characteristics but the Hanging Man is found at the top of a trend while the
Hammer is found at the bottom of a trend.
After a
strong up-trend has been in effect, the atmosphere is bullish. The price opens
higher but starts to move lower. The Bears take control. Before the end of the
day, the Bulls step in and take the price back up to the higher end of the
trading range, creating a small body for the day. This could indicate the bulls
still have control when analyzing a Western bar chart. However, the long lower
shadow represents that the sellers started stepping in at these levels. Even
though the Bulls may have been able to keep the price positive by the end of
the day the evidence of the selling was apparent. A lower open or a black
candle the next day reinforces the fact that selling is starting.
The
Hanging Man signal has a deeper analysis applied to its message. An investor,
being in a bullish frame of mind, will be a little bit nervous upon seeing the
selling during the day. However, by the end of the day the price has moved back
up toward the top of the trading range. Although a little bit nervous during
the day, the Bulls are relieved that the buying still seems to be around.
What the
Japanese have witnessed is the nervousness that the Hanging Man signal creates.
If prices opened lower the following day, the nervous Bulls from the previous
day start saying “shoot, the Bears are back
again, get me out of this trade.” Essentially,
the Hanging Man signal is the first sign that the sellers might be coming in. A
lower open, or more selling the following day convinces the Bulls that is time
to get out of the position.
Criteria
1.
The upper shadow should be at
least two times the length of the body.
2.
The real body is at the upper end
of the trading range. The color of the body is not important although a black
body should have slightly more bearish implications.
3.
There should be no upper shadow
or a very small upper shadow.
4.
The following day needs to
confirm the Hanging Man signal with a black candle or better yet, a gap down
followed by a lower close.
Signal Enhancements
1.
The longer the lower shadow, the
higher the potential of a reversal occurring.
2.
A gap-up from the previous day's
close sets up for a stronger reversal move provided the day after the Hanging
Man signal trades lower.
3.
Change Large volume on the signal
day increases the chances that a blow- off day has occurred although it is not
a necessity.
The
Hanging Man, followed by continued selling the next day, is a relatively high
probability ‘sell’ signal. When a trend is in the overbought condition, the
hanging man signal definitely needs to be addressed. As with the Hammer signal,
the longer the lower shadow in a Hanging Man signal, the more likely the Bulls
will be nervous upon seeing a lower open the next day.
A gap-up
at the top, followed by selling also signifies the sellers were showing up
immediately after the opening price. This is in keeping with the candlestick
analysis of where to start looking for candlestick sell signals, the exuberant
buying indications at the top. As viewed in Fig. 2-40, the PMC Sierra chart,
the gaps up in the overbought condition provided a forewarning that a top was nearby.
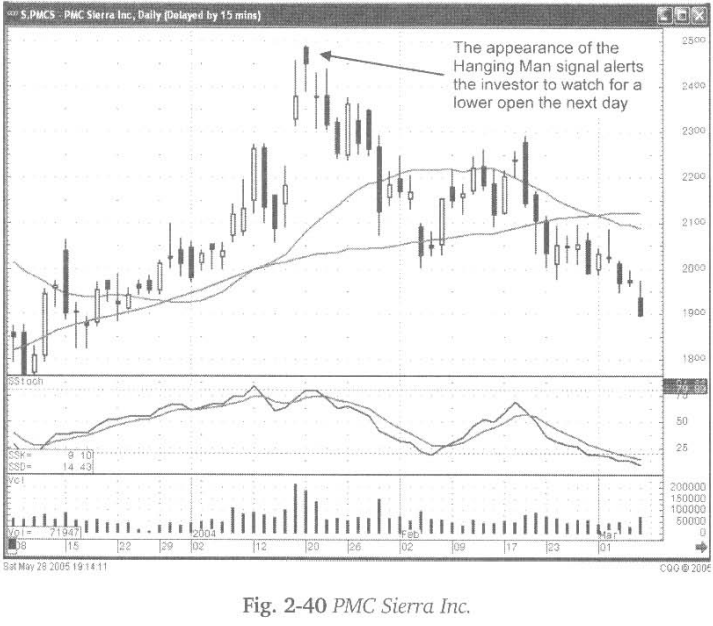
The
immediate sell-off indicated there was no new buying after the open. Although
some buying occurs before the close, the Hanging Man signal now becomes an
alert. This is a signal that would definitely not show up in Western charts.
The gap down in price the following day would have been an immediate
indication that the sellers were now controlling the trend.
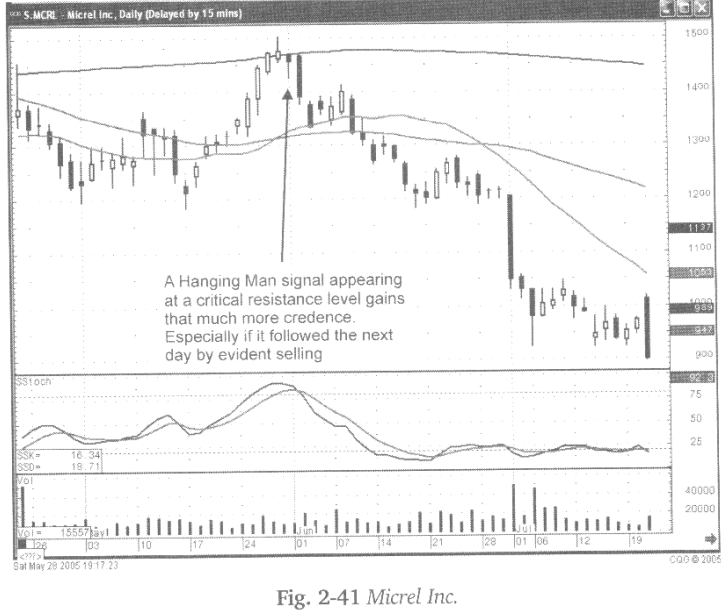
Identifying
a Hanging Man signal, along with other candlestick signals at major potential
resistance levels, adds more credence to a reversal signal occurring.
Illustrated in Fig. 2-41, the Micrel Inc. chart, the Hanging Man signal
occurred right on a major moving average. This allows the candlestick investor
to immediately evaluate what might be happening at an important technical level
that other investors are watching.
Understanding
what should occur after a Hanging Man signal, with a high probability that a
downtrend is in the making, allows an investor to close out a position more
quickly and confidently than other investors waiting for better confirmation.
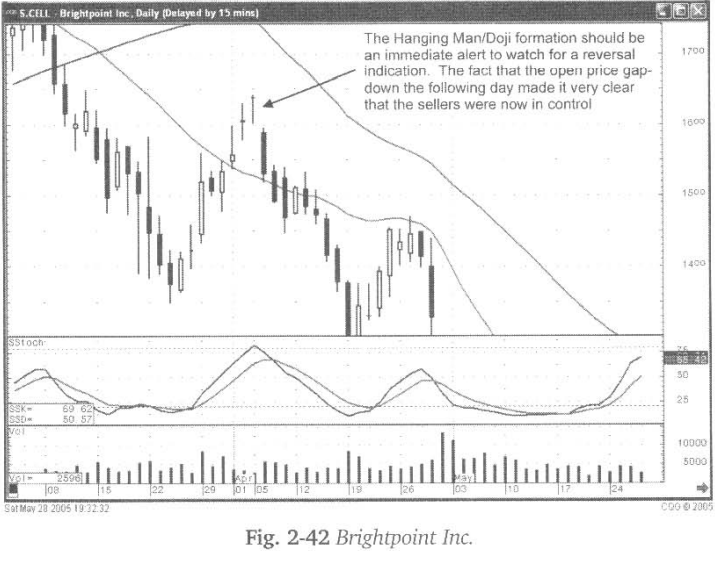
The
ultimate Hanging Man is the “Dragonfly Doji”, which has an open and close near
or at the very top of the trading range. As illustrated in Fig. 2-42, the
Brightpoint Inc. chart, a Hanging Man/Doji formation creates a visual alert.
Witnessing a much lower open the next day provides confirmation that the
uptrend is over.
The
Hanging Man signal, in an overbought condition, requires immediate attention.
The lower trading during the day made the Bulls nervous. More selling the
following day convinces the Bulls to be out of a trade. Remember, centuries of
observations have revealed this to be a major signal.
How To make High Profit In Candlestick Patterns : Chapter 1. The Major Candlestick Signals : Tag: Candlestick Pattern Trading, Forex : Hanging Man Pattern, Hammer signal, Hanging Man signal, Best Reversal pattern - Hanging Man