Bearish Engulfing Pattern
Major reversal pattern, Engulfing pattern, Engulfing body, Engulfing Trading strategy, Trend reversal Pattern, Bearish Pattern
Course: [ How To make High Profit In Candlestick Patterns : Chapter 1. The Major Candlestick Signals ]
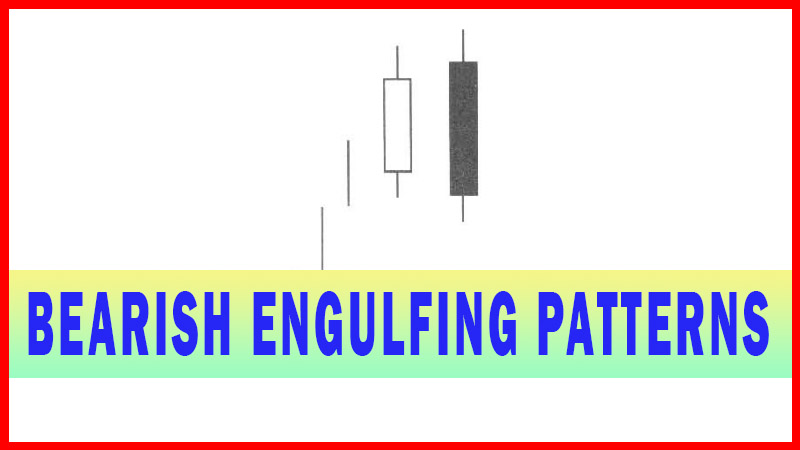
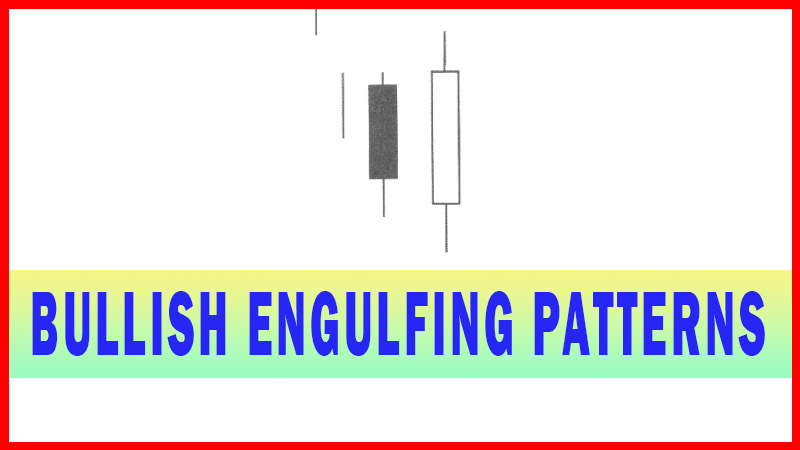
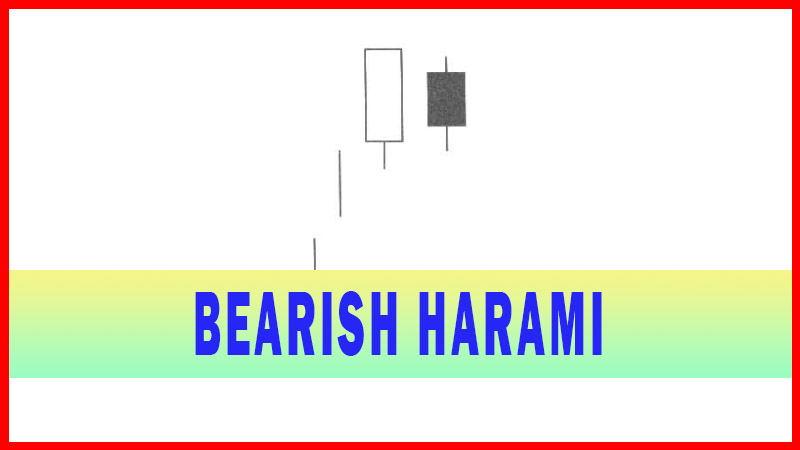
The Bearish Engulfing signal is exactly opposite the Bullish Engulfing signal. The Bearish Engulfing pattern is a major reversal pattern comprised of two opposite-colored bodies. The Bearish Engulfing Pattern (Figure 2-23) is formed after an uptrend.
ENGULFING PATTERNS
BEARISH ENGULFING
Description
The
Bearish Engulfing signal is exactly opposite the Bullish Engulfing signal. The
Bearish Engulfing pattern is a major reversal pattern comprised of two opposite-colored
bodies. The Bearish Engulfing Pattern (Figure 2-23) is formed after an uptrend.
It opens higher than the previous day's close and closes lower than the
previous days open. Thus, the black candle completely engulfs the previous
day's white candle. Engulfing can include either the open or the close being
equal to the open or close of the previous day but not both.
Criteria
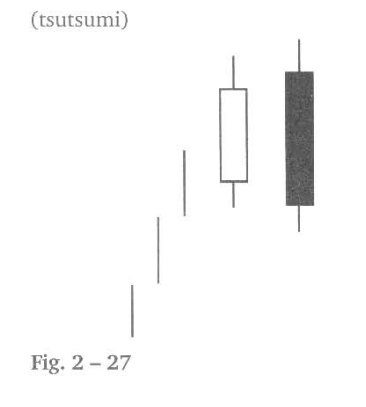
1.
The body of the second day
completely engulfs the body of the first day. Shadows are not a consideration.
2.
Prices have been in a definable
uptrend, even if it has been short term.
3.
The body of the second candle is
opposite color of the first candle, the first candle being the color of the
previous trend. The exception to this rule is when the engulfed body is a Doji
or an extremely small body.
Signal Enhancements
1.
A large body engulfing a small
bod); The previous day was showing the trend was running out of steam. The
large body 2. shows that the new direction has started with good force.
2.
When the engulfing pattern occurs
after a fast spike up, there will less supply of stock to slow down the
reversal move. A fast move makes a stock price over-extended and increases the
potential for profit taking and a meaningful pullback.
3.
Large volume on the engulfing day
increases the chances that a blow-off day has occurred.
4.
The engulfing body engulfing more
than one previous body demonstrates power in the reversal.
5.
If the engulfing body engulfs the
body and the shadows of the previous day, the reversal has a greater
probability of working.
6.
The greater the open price gaps
up from the previous close, the greater the probability of a strong reversal.
The
Bearish Engulfing signal is created with the same investor psychology as the
Bullish Engulfing signal. After an uptrend, the open of the Bearish Engulfing
signal is above the close of the previous day’s bullish body. Once again, the
investor psychology that illustrates exuberance, began the formation. A Bearish
Engulfing signal requires only to have an open above the previous days close.
The demonstration of exuberant buying, an open price much higher than the
previous day’s close and/or above the previous day’s trading range is more
significant. Where do most investors buy? Exuberantly at the top!
The
further to the upside that the Bearish Engulfing signal opens, the more
convincing the Bearish Engulfing signal becomes. It clearly illustrates that
the Bears have now taken over control of the trend. As with the Bullish Engulfing
signal, the Bearish Engulfing signal is visually clear to identify. It is a
dark candle after an uptrend of bullish candles.
A Bearish
Engulfing signal following another candlestick sell signal adds more conviction
to a downside move. As illustrated in Fig. 2-28 the Novatel Wireless Inc.
chart, the Bearish Engulfing signal is initially created with a gap- up in overbought
conditions.
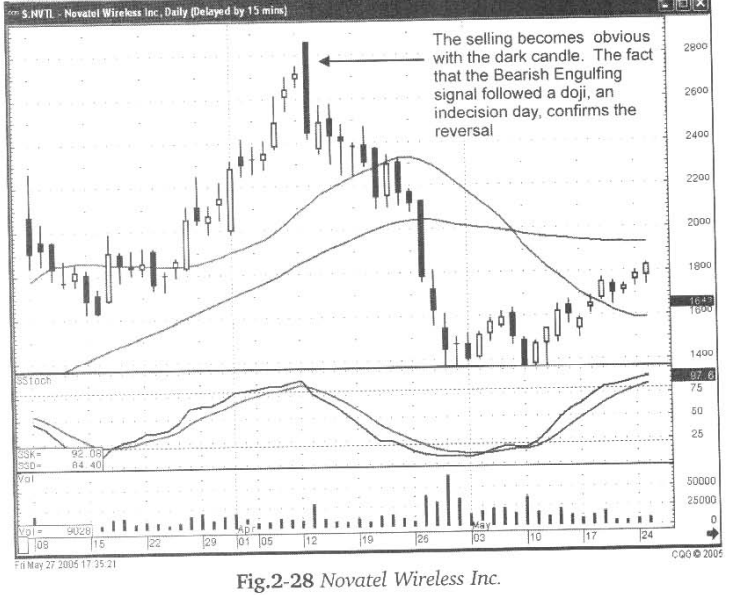
A gap-up
in price, followed the Doji/Spinning Top formation of the previous day. The
bearish trading of that day confirms the indecision that was developing in the
previous day’s signal. As with all the major signals, the signal itself is the
most important factor. Confirming indicators, such as stochastics, are just
that, confirming indicators.
The
Bearish Engulfing signal witnessed in Fig. 2-29 (following page), the Abgenix
chart, occurred at a significant level. Although the stochastics were not near
an overbought condition, a Bearish Engulfing signal occurring exactly at the 200-day
moving average is meaningful.
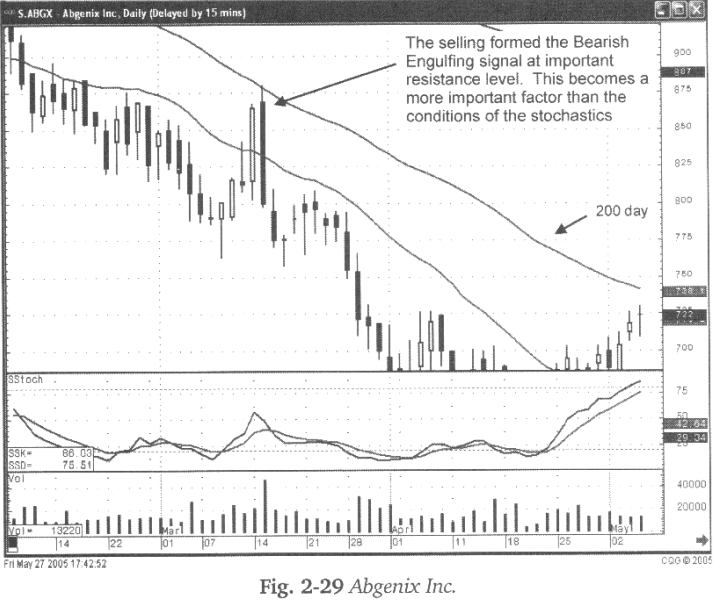
It
clearly illustrated that the sellers made their presence known once an important
resistance level had been touched
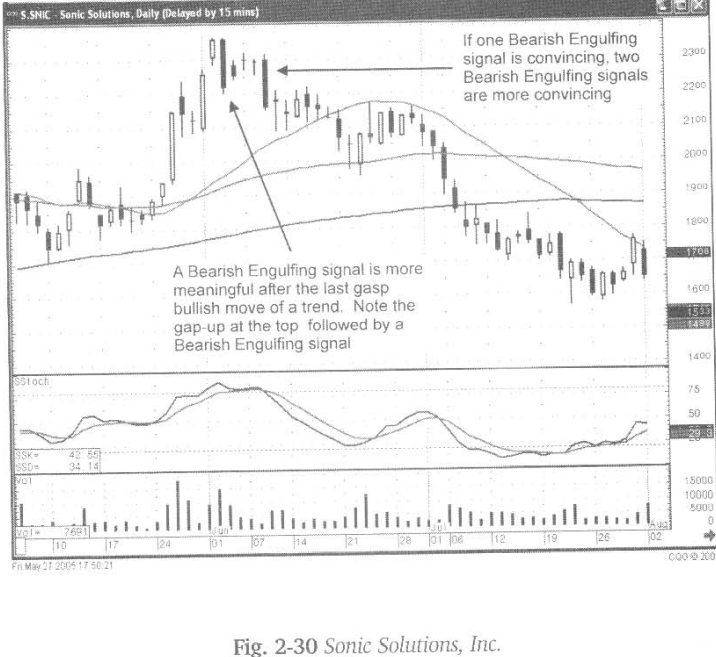
A Bearish
Engulfing signal gains more credibility after witnessing the obvious topping
signals of a trend. Notice in fig. 2-30, the Sonic Solutions chart (following
page), the uptrend shows topping signals with a gap up in the overbought condition.
This would be the area to start looking for a candlestick sell signal. The
formation of the Bearish Engulfing signal, the following day, is more relevant
after the gap-up. The second Bearish Engulfing signal four days later reaffirms
that the sellers have come into this price. Both long dark candles provide more
evidence that the sellers are now in control.
The
Bearish Engulfing signal can be created by opening higher than the previous
day’s close. If the open is higher than the previous day’s trading range, stop-
loss procedures can easily be implemented. Stop-loss procedures will be further
discussed in the Entry and Exit Strategy chapter. The completion of a Bearish
Engulfing signal, in an overbought condition, allows investors to prepare for
short trade potentials.
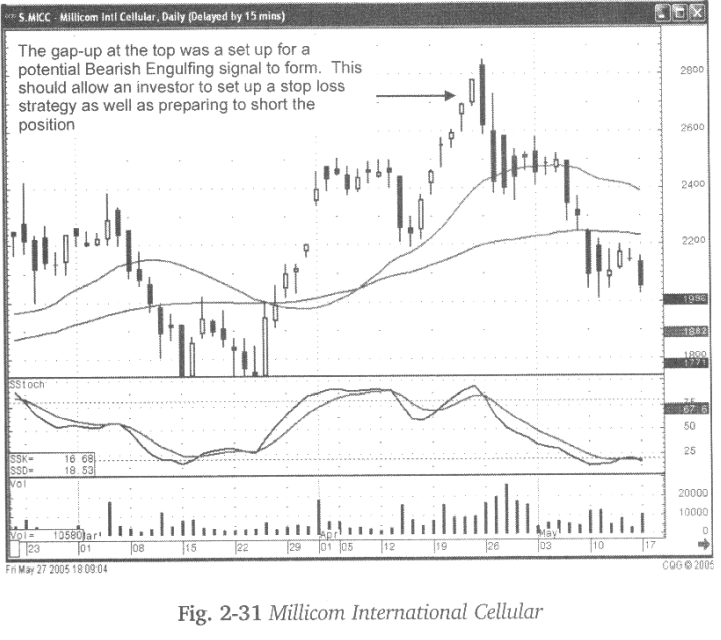
Notice in
Fig. 2-31, the Millicom International Cellular chart, the gap up in the
overbought condition was the first indication of a bearish signal being formed.
A ‘close’ below the previous days open, as well as the open on the candle two
days prior, made for a strong Bearish Engulfing signal. Not only should this
have closed out any long positions, it should have set the stage for shorting
the stock.
The
Bearish Engulfing signal portrays the same characteristics as found in the
Bullish Engulfing signal. A Bearish Engulfing signal viewed in an overbought
condition projects an extremely high probability of the trend turning down.
What happens when a Bearish Engulfing signal is seen in an oversold condition?
As with the Bullish Engulfing signal viewed in the overbought condition,
representing last gasp buying, a Bearish Engulfing signal provides the same
alert. A Bearish Engulfing signal in an oversold condition demonstrates the
final selling.
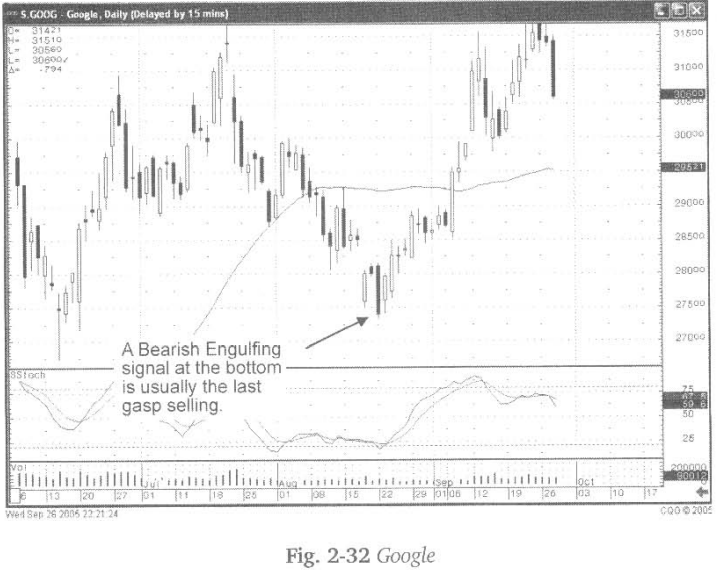
When viewing
a Bearish Engulfing signal in oversold condition, an investor should be
prepared for a bullish signal to occur very soon. As an alert for the bull to
start watching for a buy signal, it should also forewarn the investor with a
short position to be prepared to cover as seen in Fig. 2-32, the Google chart
The
Bullish and the Bearish Engulfing signals are both highly effective candlestick
signals.
They can
easily be recognized visually on a chart. Incorporating investor psychology
that is built into those signals allows the candlestick investor to take
advantage of tread reversals at the most opportune rimes. The signals,
occurring in overbought or oversold conditions, make their effectiveness that
much greater. The engulfing patterns reveal a significant change in investor
sentiment. They should always be addressed. The Bullish and the Bearish Engulfing
signal, occurring at other major technical levels, provide a significant
meaning. Do not ignore these signals.
How To make High Profit In Candlestick Patterns : Chapter 1. The Major Candlestick Signals : Tag: Candlestick Pattern Trading, Forex : Major reversal pattern, Engulfing pattern, Engulfing body, Engulfing Trading strategy, Trend reversal Pattern, Bearish Pattern - Bearish Engulfing Pattern