Shooting Star Pattern
Shooting Star signal, Hammer signal, candlestick signals, Hanging Man, Bearish Engulfing signal
Course: [ How To make High Profit In Candlestick Patterns : Chapter 1. The Major Candlestick Signals ]
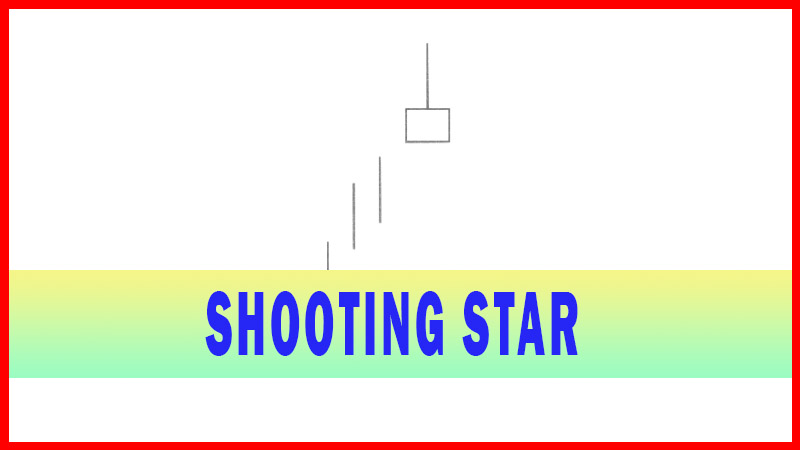
The Japanese named this pattern because it looks like a shooting star falling from the sky with the tail trailing it. As with the shooting star, the trend should now be falling to the ground. The Shooting Star is comprised of one candle.
SHOOTING STAR (Nagare Boshi)
Description
The Japanese named this pattern because it looks like a shooting
star falling from the sky with the tail trailing it. As with the shooting star,
the trend should now be falling to the ground. The Shooting Star is comprised
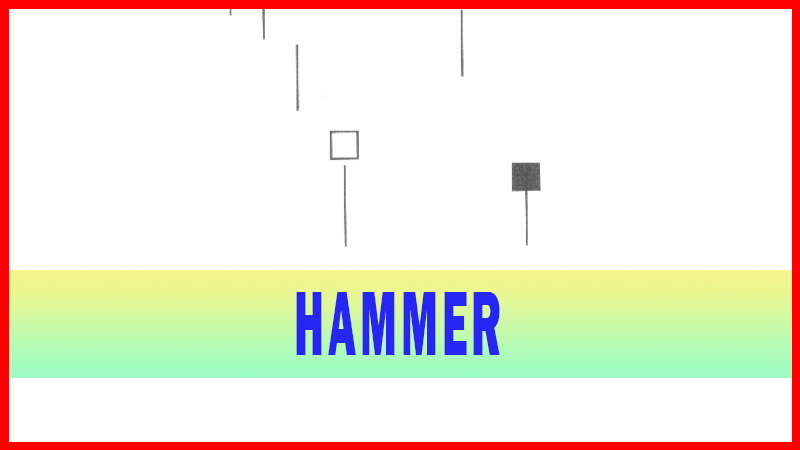
of one candle. It is formed completely opposite the Hammer signal at the
bottom. It is easily identified by the presence of a small body with an upper
shadow at least two times greater than the body. The Shooting Star is found at
the top of an uptrend.
The predominant
identifying aspect to the Shooting Star signal is the “tail” sticking into the
air. The longer the tail, the stronger the evidence that after the Bulls pushed
prices up, the Bears knocked it back down. The body of a Shooting Star can be
either black or white. The main feature of the signal is that the tail is at
least two times greater than the body. After a strong up-trend has been in
effect, the atmosphere is Bullish. The price opens and trades higher. The Bulls
are in control. But before the end of the day, the Bears step in and take the
price back down to the lower end of the trading range, creating a small body
for the day. The smaller the body, the more convincing the signal becomes. The
fact that the Bears push the price back down to the lower end of the trading
range, although forming a white body, still reveals the presence of the
sellers. If the sellers pushed the price down through the opening price and
closes lower, creating a black body, that is more evidence the sellers have
taken control.
The
facets built into candlestick signals provide an immense amount of information
that would not be found in conventional bar charts. Even though the Bulls may
have been able to keep the price positive by the end of the day, the evidence
of the selling was apparent. A lower open or a black candle the next day
reinforces the fact that selling is going on.
Criteria
1.
The upper shadow should be at
least two times the length of the body
2.
The real body is at the lower end
of the trading range. The color of the body is not important although a black
body has implications that are slightly more Bearish.
3.
There should be no lower shadow
or a very small lower shadow.
4.
The following day needs to
confirm the Shooting Star signal with a black candle or better yet, a gap down
with a lower close.
Signal Enhancements
1.
The longer the upper shadow, the
higher the potential of a reversal occurring.
2.
A gap up from the previous day’s
close sets up for a stronger reversal move, provided the day after the Shooting
Star signal opens lower.
3.
Large volume on the Shooting Star
Day increases the chances that a blow- off day has occurred, although it is not
a necessity.
The
Shooting Star signal indicates failure, the failure of the Bulls to continue
the trend. When witnessing an upper shadow that appears to be stretching up to
nowhere, start anticipating the change of investor sentiment. The Hammer signal
illustrates the failure of the Bears to continue the downtrend. The shooting
star signal reveals the same failure of the Bulls at the top. It is not uncommon
to see other candlestick sell signals in conjunction with the shooting star
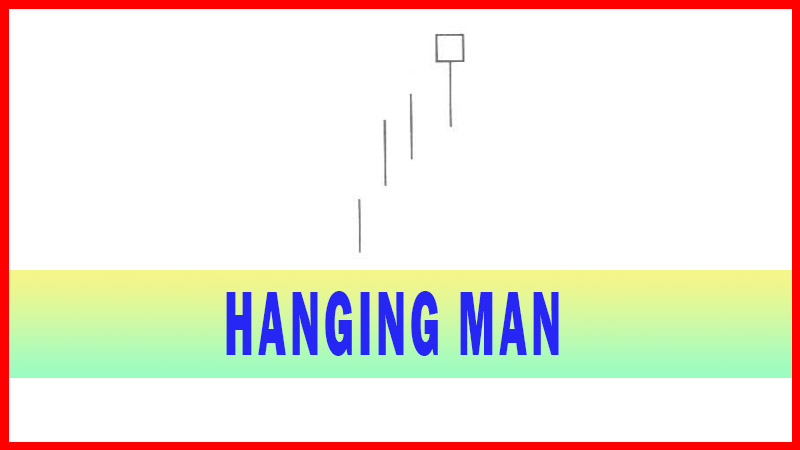
signal. Note in Fig. 2-61, the Immtech International chart how a Hanging Man
formed prior to the Shooting Star. The stochastics are in the overbought area.
The Hanging Man signal indicated the starting weakness of the trend.
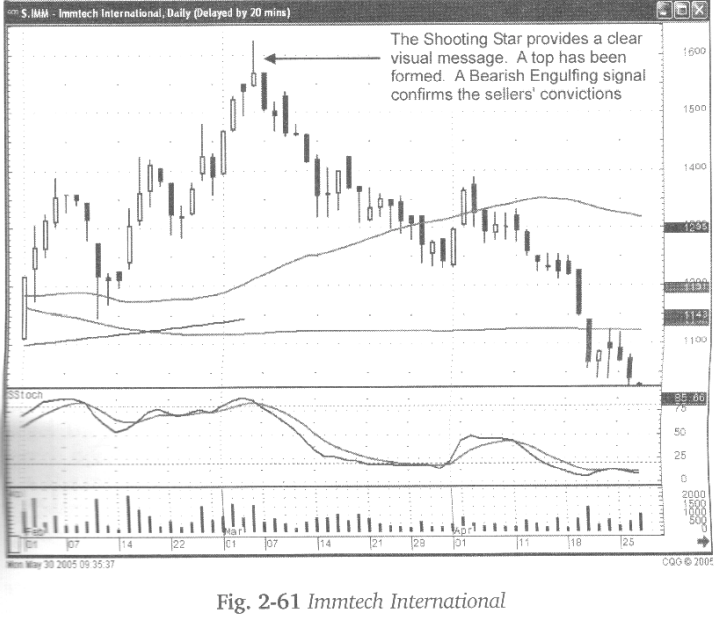
The
Shooting Star signal illustrates the Bears started taking action. The Bearish
Engulfing signal following the Shooting Star confirms that the sellers have
entered the trade. Visually the Shooting Star illustrates that the new heights
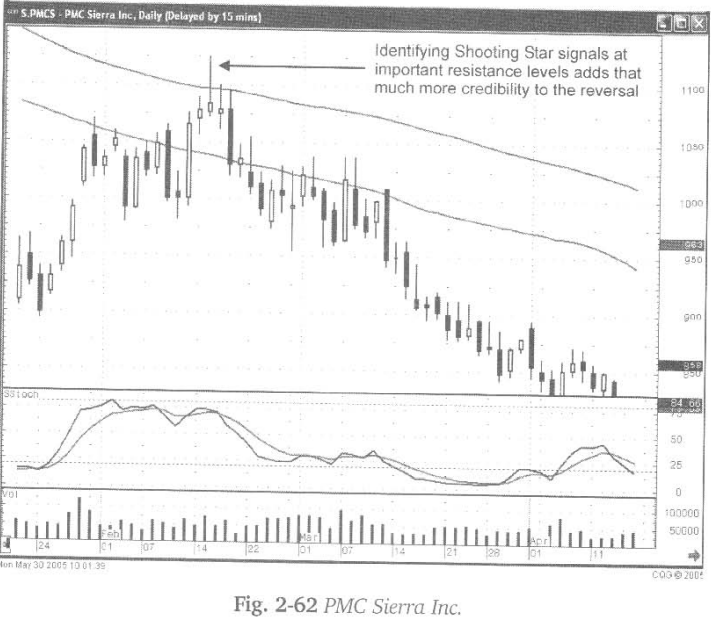
in price were pushed back down. The Shooting Star signal can also indicate the
failure of the trend at important resistance levels. A combination of signals
creates that much greater evidence that a reversal is occurring.
As
illustrated a in Fig. 2-62, the PMC Sierra Inc. chart, the uptrend became
indecisive at a major moving average. The scenario of this trend may have been
completely different had the Bulls been able to maintain the price up through
an important resistance level.
How To make High Profit In Candlestick Patterns : Chapter 1. The Major Candlestick Signals : Tag: Candlestick Pattern Trading, Forex : Shooting Star signal, Hammer signal, candlestick signals, Hanging Man, Bearish Engulfing signal - Shooting Star Pattern