Bullish Harami
Profitable Candlestick Trading, Harami signal , bearish candle, Reversal Pattern
Course: [ How To make High Profit In Candlestick Patterns : Chapter 1. The Major Candlestick Signals ]
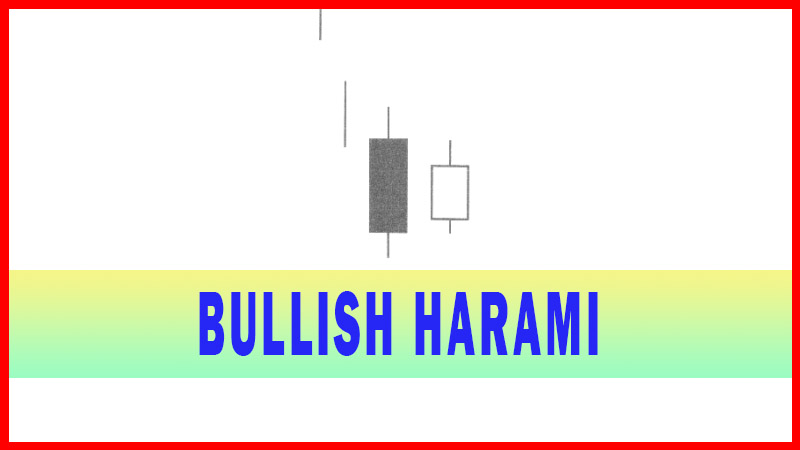
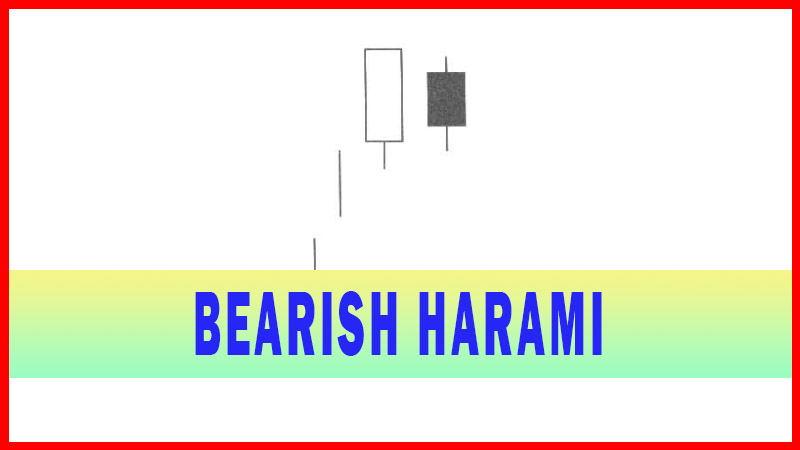
The Japanese definition for Harami is “pregnant woman” or “body within”. Western terminology would call the Harami an inside trading day. It is comprised of two candles. The first candle is black, a continuation of the existing trend.
HARAMI
BULLISH HARAMI
Description
The Japanese definition for Harami is “pregnant woman” or “body
within”. Western terminology would call the Harami an inside trading day. It is comprised of two candles. The first candle
is black, a continuation of the existing trend. The second candle, the little
belly sticking out, is usually white, but that is not always the case (See Homing Pigeon, Profitable Candlestick Trading, p. 96).
The location and size of the second candle will influence the magnitude of the
reversal.
The Harami signal conveys some important information. It says
that the previous trend is over. The appearance of a Harami signal will convey
the same information after an extended downtrend or one or two days of a
pullback.
After a strong down trend has been in effect and after a ‘long
candle’ selling day, the bulls open the price higher than the previous close.
The short’s become concerned and start covering. The price finishes higher for
the day.
This is
enough support to have the short sellers take notice that the trend has been
violated. A bullish day alter that would convince everybody that the trend was
reversing. Usually, the volume is above the recent norm due to the unwinding
of short positions. One of the visual benefits provided by the Harami signal is
the indication of how strong the potential of the new trend will be. It acts as
a barometer. The signal works most effectively after an extended downtrend
concluded with the large black candle at the bottom of the trend or a gap down
black candle. The appearance of a Harami signal the following day reveals that
the selling has stopped. The size of the Harami or where it is formed in the
previous days black candle is significant.
Criteria
1.
The body of tine first candle is
black; the body of the second candle is white.
2.
The downtrend has been evident
for a good period. A long black candle occurs at the end of the trend.
3.
The second day opens higher than
the dose of the previous day and closes lower than the open of the prior day.
4.
Unlike the Western “Inside Day”,
just the body needs to remain in the previous day's body, where as the “Inside
Day” requires both the body and the shadows to remain inside the previous day’s
body.
5.
For a reversal signal, further
confirmation is required to indicate that the trend is now moving up.
Signal Enhancements
1.
The longer the black candle and
the white candle, the more forceful the reversal.
2.
The higher the white candle
closes up on the black candle, the more convincing that a reversal has
occurred despite the size of the white candle.
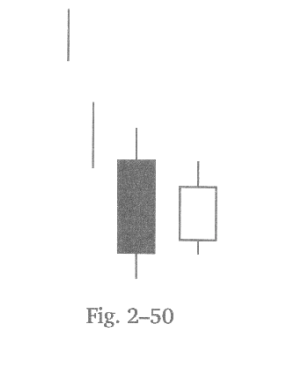
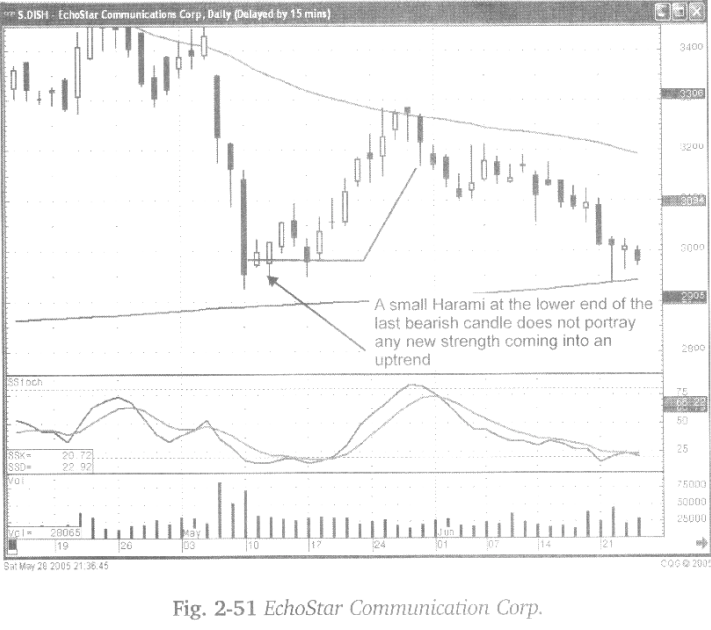
A Harami
forming at the very lower end of the last bearish candle of a downtrend
provides some insights. Although it illustrates that the selling has stopped,
it also illustrates that there is not much buying impetus. The potential
uptrend may not be immediate or very strong.
As seen
in Fig. 2-51. the EchoStar Communication Corp. chart, the Bullish Harami was
very small and stayed near the bottom of the previous black candle’s trading
range. The subsequent buying took a while to get started, not showing any great
immediate strength.
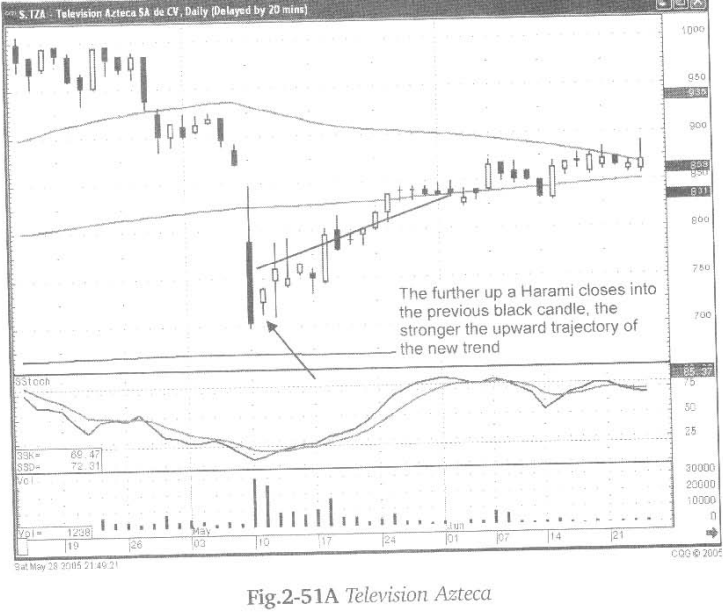
The
higher the close of Harami into the previous days black candle, the stronger
the trajectory of the new uptrend. The Harami requires bullish confirmation
the following day. The Harami signal itself indicates the downtrend has
stopped. Continued buying the next day reveals the uptrend is now in progress.
As viewed
in Fig.2-51A, the Television Azteca chart, the Harami closing just above the
bottom third of the previous black candle, followed by a bullish open the
following day, started a decent up trend. The stochastics are an additional
confirming parameter.
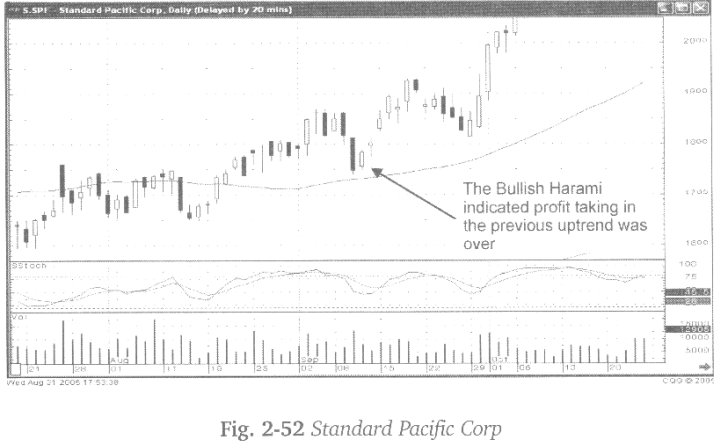
The
Harami works very well for indicating whether important support levels are
going to hold. As seen in Fig. 2-52 (following page), the Standard Pacific
Corp. chart, a bullish Harami revealed that the uptrend was going to continue
after the pullback. A pullback moving very near to the 50-day moving average.
Although the stochastics were not in the oversold condition, it could be
deduced that the pullback was over, the price stayed above the moving average,
in the process of continuing the uptrend. Remembering that the Harami indicates
selling has stopped, it becomes an effective visual indicator when trying to
analyze existing mends.
How To make High Profit In Candlestick Patterns : Chapter 1. The Major Candlestick Signals : Tag: Candlestick Pattern Trading, Forex : Profitable Candlestick Trading, Harami signal , bearish candle, Reversal Pattern - Bullish Harami