Bearish Harami
Profitable Candlestick Trading, Harami signal , bearish candle, Reversal Pattern
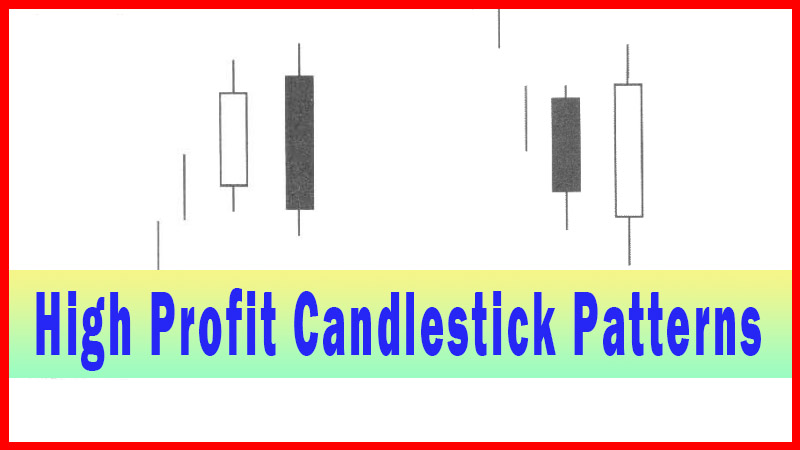
Course: [ How To make High Profit In Candlestick Patterns : Chapter 1. The Major Candlestick Signals ]
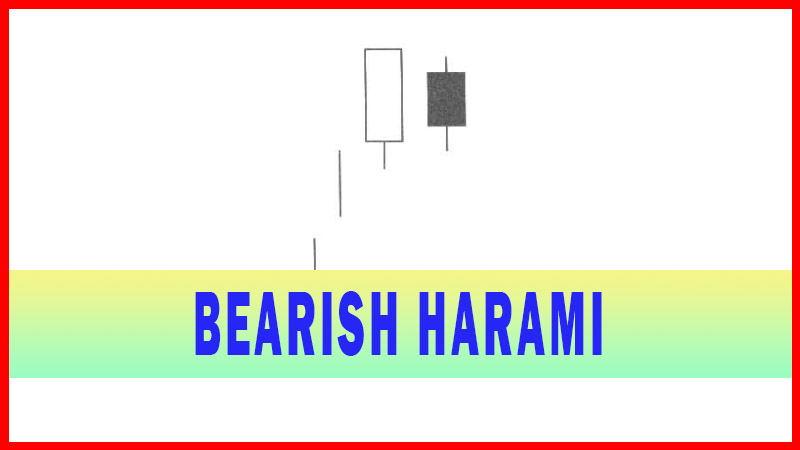
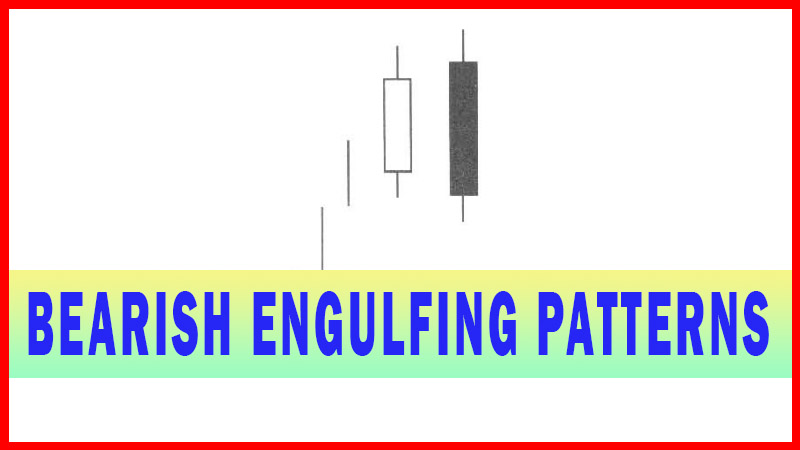
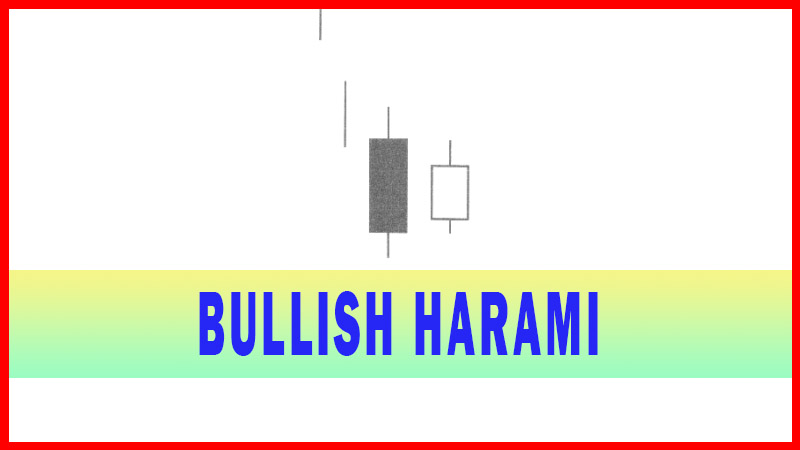
The Bearish Harami is the exact opposite of the Bullish Harami. The pattern is composed of a two-candle formation. The body of the first candle is the same color as the current trend. The first body of the pattern is a long body, the second body is smaller.
HARAMI
BEARISH HARAMI

Description
The
Bearish Harami is the exact opposite of the Bullish Harami. The pattern is
composed of a two-candle formation. The body of the first candle is the same
color as the current trend. The first body of the pattern is a long body, the
second body is smaller. The open and the close of the second body occurs inside
the open and the close of the previous day. The appearance of a Bearish Harami
indicates that the uptrend has stopped. The uptrend can be extensive or a one-
or two-day trend. The Bearish Harami becomes more significant if it occurs at
important resistance levels. After a strong up trend has been in effect and
after a long white candle day the appearance of a Harami is more significant.
Bears open the price lower than the previous close. The longs get concerned and
start profit taking. The price finishes lower for the day. The Bulls are now
concerned as the price closes lower. It is becoming evident that the trend has
been violated. A weak day after that would convince everybody that the trend
was reversing. Volume increases due to the profit taking and the addition of
short sales.
Criteria
1.
The body of the first candle is
white, the body of the second candle is black.
2.
The up trend has been apparent. A
long white candle occurs at the end of the trend.
3.
The second day opens lower than
the close of the previous day and closes higher than the open of the prior day.
4.
For a reversal signal,
confirmation is needed. The next day should show weakness.
Signal Enhancements
1.
The longer the white candle and
the black candle, the more forceful the reversal.
2.
The lower the black candle closes
down on the white candle, the more convincing that a reversal has occurred,
despite the size of the black candle.
If you
break down the aspects of the Bearish Harami, it makes understanding why the
signal works much easier. Consider what occurs in the formation of a Bearish
Harami. After an uptrend has been in progress, the formation of a Harami is
inconsistent with the expectations of the uptrend. The first day of the two-day
Harami signal is a bullish candle. The bullish candle coincides with the
expectations of the price move in an upward trend. The price opens and continues
to move higher. The following day, the price opens lower than the previous
day’s close. That in itself does not stifle an uptrend.
The
factor, not congruent with an up-trending price, is that no further strength is
seen in the price move. The lower open may or may not see additional buying
during the day. The prices moving lower by the end of the day become the
relevant indicator. It becomes obvious that the buying has started waning,
especially when stochastics are in an overbought condition. This should be an
indication that investor sentiment has taken an obvious turn. Prices opening
lower than the previous days close and then continuing to close below the
opening price reveals selling pressure.
Fig.2-55,
The Cross-Country Healthcare chart illustrates a Harami signal. The
probabilities become extremely high that the uptrend is over. Will the Harami
signal identify the absolute top in all trends? Definitely not! However, the
signal will suggest that the majority of the move is over.

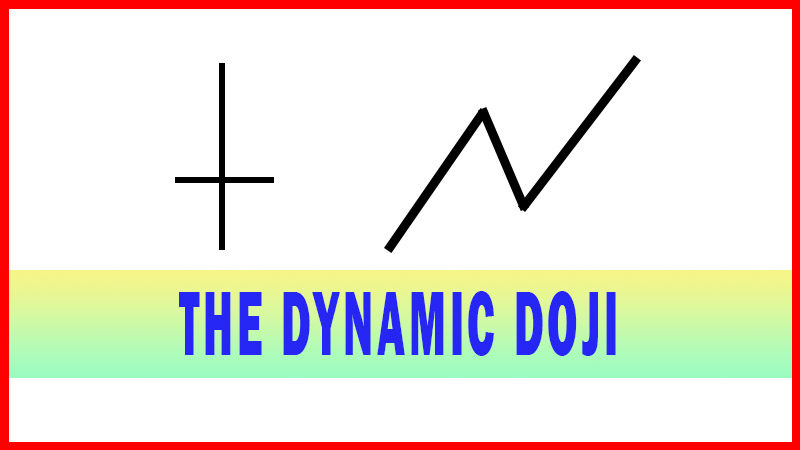
A common
Bearish Harami signal involves a Doji. An upward price move followed by a
Doji/Harami signal is easy to interpret, especially when the trading has moved
into the overbought condition. A Doji represents indecision. A Harami indicates
the buying has stopped.
What is
expected after a Doji/Harami? A high likelihood that the sellers may be coming
in, as indicated in Fig. 2-56, the Aspen Corporation chart. A lower open
following a Doji/Harami confirms the signal. The probabilities are now
extremely high that the uptrend has stopped and a downtrend may be starting.
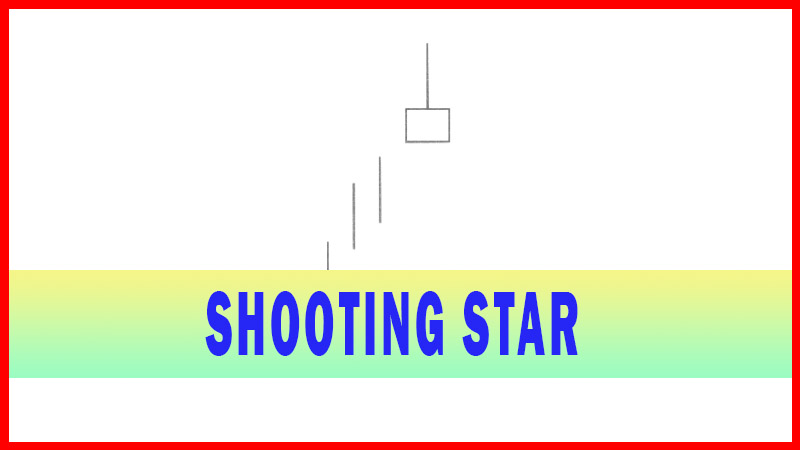
The Bearish Harami followed by additional candlestick ‘sell’ signals, such as a
Shooting Star and/or Doji should be analyzed as a group scenario. The Bearish Harami
provides the initial information. The buying has stopped. The following
candlestick signals produce additional confirmation to what the Harami is
revealing.

Fig.
2-57, The Fuel Cell Energy Corporation chart provides a clear Harami indicator.
The uptrend, now shown to be stopped, is experiencing more indications of
indecision at these levels. When the stochastics start turning down, it further
confirms the buying forces have disappeared.

If one
Bearish Harami signal reveals a potential reversal of a trend, then witnessing
two Bearish Harami’s in close proximity should be clearer confirmation. The
M-Systems Flash Disk Pioneers Ltd. chart reveals simple logic in viewing two
Bearish Harami’s at the top.
The first
signal illustrates that the buying stopped. After pulling back, the Bulls make
another attempt to move the price up, followed by another Bearish Harami. This
should become obvious that the Bears knock the prices back down when the bulls
try to advance.
Bearish
signals were occurring right near a major moving average. The stochastics were
starting to roll over, making for an easy analysis. The sellers are starting to
take control. This is illustrated in Fig. 2-58, the M-Systems Flash Disk
Pioneers Ltd. Chart.

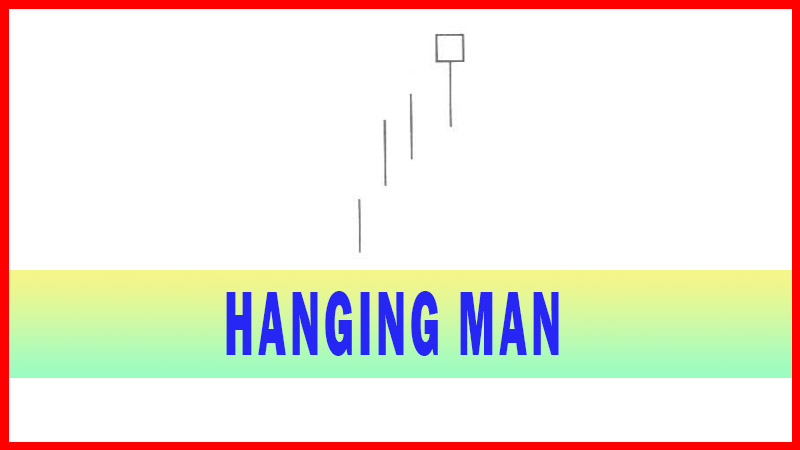
As
illustrated in Fig. 2-59, the Landrys Seafood Rest, chart, like the Doji acting
as a combination signal with the Bearish Harami, the same can be seen with the
Hanging Man signal. The analysis should be the same. The Harami indicates that
the selling has stopped. The bearish implication the Hanging Man signal
conveys, added to the implication a Bearish Harami conveys, produces a strong
argument that any further weakness should start a downtrend.

The
Bearish Harami has one basic informative fact. The uptrend has ended. Observing
the Bearish Harami signal at major technical levels, and appearing when the
stochastics indicate an overbought situation, produces a high probability
factor. The uptrend has stopped. Now start watching for further selling to
confirm that a downtrend is starting.
How To make High Profit In Candlestick Patterns : Chapter 1. The Major Candlestick Signals : Tag: Candlestick Pattern Trading, Forex : Profitable Candlestick Trading, Harami signal , bearish candle, Reversal Pattern - Bearish Harami