Piercing Pattern
Piercing Pattern, Spinning Top, Bullish Engulfing signal, Two-candle formation, bullish signal, Piercing signal pattern, Bullish Engulfing signal
Course: [ How To make High Profit In Candlestick Patterns : Chapter 1. The Major Candlestick Signals ]
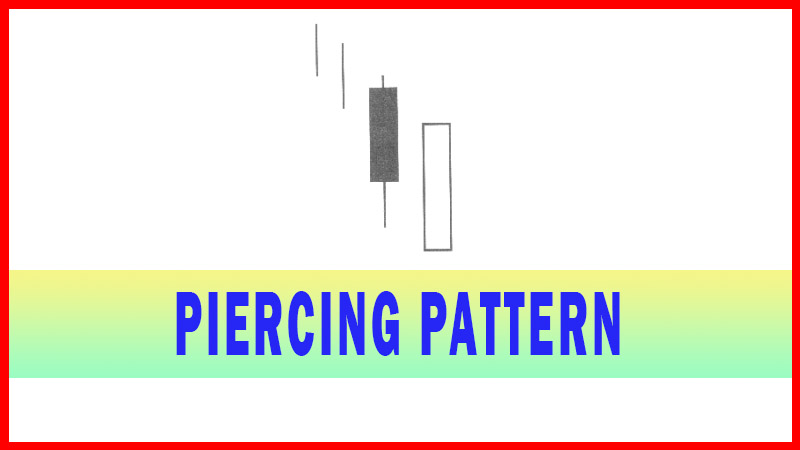
The Piercing Pattern, a bullish signal, is composed of a two-candle formation in a down-trending market. The first candle is black, a continuation of the existing trend. The second candle is formed by opening below the low of the previous day.
PIERCING PATTERN (Kirikomi)
Description
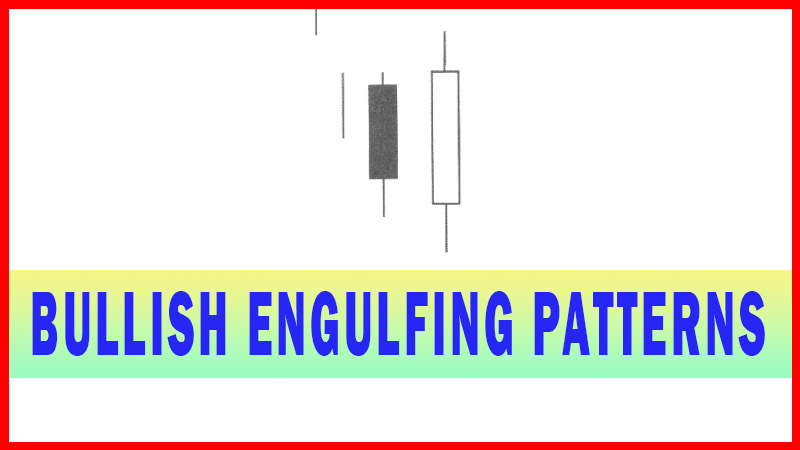
The Piercing Pattern, a bullish signal, is composed of a two-candle formation in a down-trending market. The first candle is black, a continuation of the existing trend. The second candle is formed by opening below the low of the previous day. It closes more than midway up the black candle, near or at the high for the day. The Piercing pattern has almost the same elements as the Bullish Engulfing signal. The differences are that the open, unlike the Bullish Engulfing signal, opens well below the previous day’s trading range. The Bullish Engulfing signal only requires the open below the previous day’s close. This lower open is now a gap down in an oversold condition. Again, this incorporates the aspect that most sellers “panic sell” at the bottom. The remainder of the day shows buying. That buying continues into the close, closing more than half way into the previous day’s black candle. Closing above the halfway point of the previous black candle is the most important factor. A close below the halfway point produces other candlestick evaluations.
As with other candlestick ‘buy’ signals, the magnitude in which the lower open occurs is important. The lower the Piercing signal opens, the further down the gap down open occurs, the stronger the probabilities of a reversal occurring as well as the implied strength of the new uptrend. Additionally, the higher the close occurs in the previous day’s black candle, the better the probabilities of a strong reversal. It is not unusual to see a large volume day occurring in a severe Piercing signal pattern. The increase in volume implies that the weak have sold their shares to the smart money.
Criteria
1. The body of the first candle is black; the body of the second candle is white.
2. The downtrend has been evident for a good period. A long black candle occurs at the end of the trend.
3. The second day opens lower than the trading of the prior day.
4. The white candle closes more than half-way up the black candle.
Signal Enhancements
1. The longer the black candle and the white candle, the more forceful the reversal.
2. The greater the gap-down from the previous day’s close, the more pronounced the reversal.
3. The higher the white candle closes into the black candle, the stronger the reversal potential.
4. Large volume during these two trading days is a significant confirmation.
The gap-down in an oversold condition becomes the first indication that a candlestick reversal signal might occur. The open price, occurring below the previous day's low, followed by a close more than halfway up the previous black candle, makes this a viable buy signal. Additional parameters such as the
stochastics being in the oversold condition lend more credibility to the signal.
Although not as strong a candlestick signal as the Bullish Engulfing signal, the Piercing signal conveys the same information. Once the sellers capitulated at the bottom, the buyers came back into the price trend. As can be seen in Fig. 2- 44, the Marathon Oil Corp. chart, the downtrend was reversed with the appearance of the Piercing pattern.
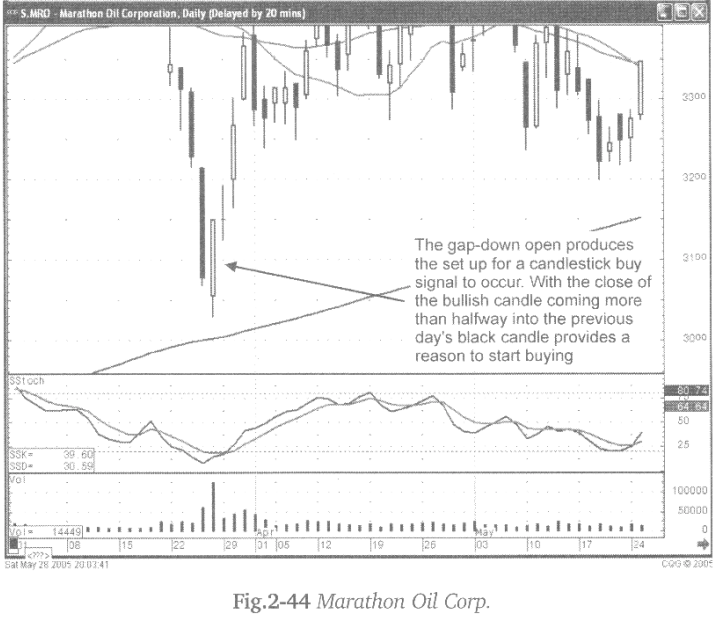
A gap-down at the bottom of the trend, followed by obvious buying, reveals that there has been a change of investor sentiment. What confirmation is needed after a Piercing signal? A positive open the following day demonstrating the buying revealed in the signal is still present. This provides evidence that the buyers are still involved.
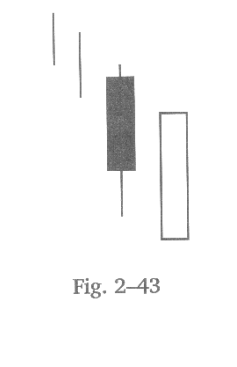
Fig. 2-45, The Petroleum Development Corp. chart illustrates the characteristics found in a Piercing signal. After observing a lengthy downtrend, prices gap down below the previous day’s trading range. The previous day illustrated a somewhat indecisive day, a Spinning Top.
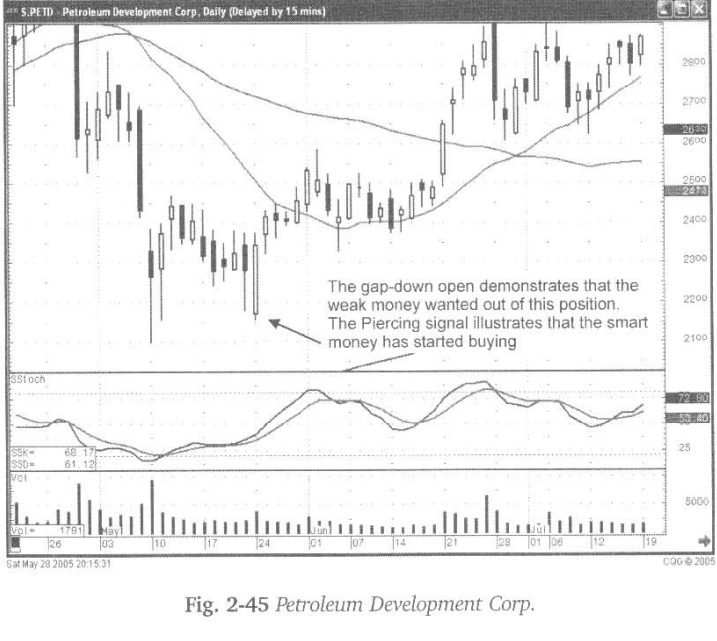
The evidence of buyers stepping in after the open reveals that the selling was the last gasp sales of the weak investors. The large bullish candle clearly demonstrates that once the last of the selling occurred, the buyers started coming in with force. The additional buying strength of the following day added further confirmation that the uptrend was now in progress.
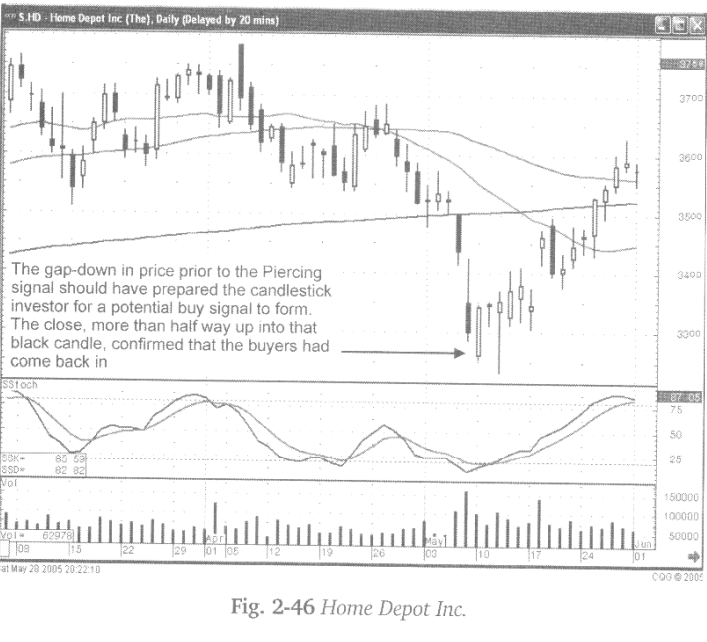
Fig. 2-46, The Home Depot chart illustrates a Piercing signal after the apparent exuberant selling at the bottom. The previous day gapped down on hefty volume. The gap down on the day of the formation of the Piercing signal, with stochastics in the oversold condition, would have alerted the candlestick investor to get ready for a candlestick buy signal to form soon.
Watching the buyers move the price well above the halfway point of the gap- down black candle would have informed the candlestick investor that the buyers were now back in the trade. The visibility of this large white candle against the black candle downtrend makes it obvious that something has changed in investor sentiment.
How To make High Profit In Candlestick Patterns : Chapter 1. The Major Candlestick Signals : Tag: Candlestick Pattern Trading, Forex : Piercing Pattern, Spinning Top, Bullish Engulfing signal, Two-candle formation, bullish signal, Piercing signal pattern, Bullish Engulfing signal - Piercing Pattern