Bullish Engulfing Pattern
Major reversal pattern, Engulfing pattern, Engulfing body, Engulfing Trading strategy, Trend reversal Pattern
Course: [ How To make High Profit In Candlestick Patterns : Chapter 1. The Major Candlestick Signals ]
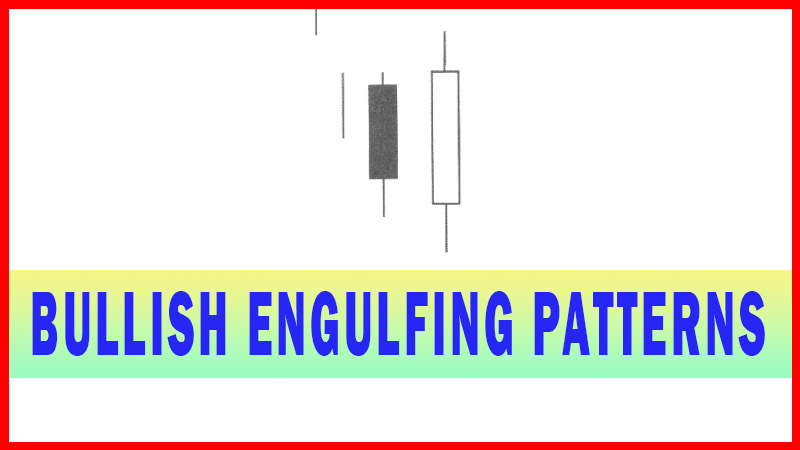
The Bullish Engulfing Pattern Is a very easy signal to identify. At the end of a down trend, it becomes evident that the Bulls are now involved. The Bullish Engulfing pattern is a major reversal pattern comprised of two opposite colored bodies.
ENGULFING PATTERNS
BULLISH ENGULFING
Description
The
Bullish Engulfing Pattern Is a very easy signal to identify. At the end of a
down trend, it becomes evident that the Bulls are now involved. The Bullish
Engulfing pattern is a major reversal pattern comprised of two opposite colored
bodies. It opens lower than the previous day’s close and closes higher than the
previous days open. Thus, the white candle completely engulfs the previous
day’s black candle body. This produces a clear visual graphic that in the early
part of the trading, the Bears were still in control. As the time frame moves
on, the Bulls started stepping in and continue to buy all the way past the open
of the previous day. The graphic itself illustrates that there is now strong
bullish sentiment in the price at these levels. The Engulfing Signal can be
formed with the open and the close of one end of the pattern being equal but
not open and close of both days being equal.
Engulfing
patterns are considered major signals for two reasons. First, they occur often
and second, they produce a high probability that the trend has reversed. Not
only has the trend reversed, but the buyers have come in with enthusiasm. The
most obvious element of the engulfing signal is a candle body color that is
completely opposite of the previous trend.
Criteria
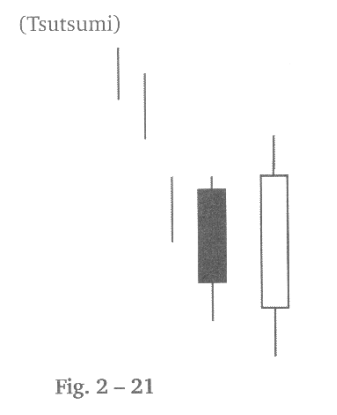
The body
of the second day completely engulfs the body of the first day. Shadows are
not a consideration. Prices have been in a definable down trend, even if only
for a short term. The body of the second candle is the opposite color of the
first candle, and the first candle is the color of the previous trend. The
exception to this rule is when the engulfed body is a Doji or an extremely
small body.
Signal Enhancements
1.
A large body engulfing a small
body. The small body shows the trend is running out of steam. The large body
indicates the new direction has started with good force.
2.
When the engulfing pattern occurs
after a fast move down, there is less supply of stock to slow down the reversal
move. A fast move makes a stock price over-extended and increases the potential
for profit taking. Large volume on the engulfing day increases the chances that
a blow-off day has occurred.
3.
An engulfing body which engulfs
more than one previous body demonstrates power in the reversal. If the
engulfing body engulfs the body and the shadows of the previous day, the
reversal has a greater probability of working.
4.
The greater the open price gaps
down from the previous close, the greater the probability of a strong reversal.
The
appearance of a Bullish Engulfing signal when stochastics is in an oversold
condition produces an extremely high probability that the trend will move to
the upside. Some features of the engulfing body can make it more convincing.
The bigger the engulfing body is compared to the last down trending body, the
more likely the uptrend will move with significant force.
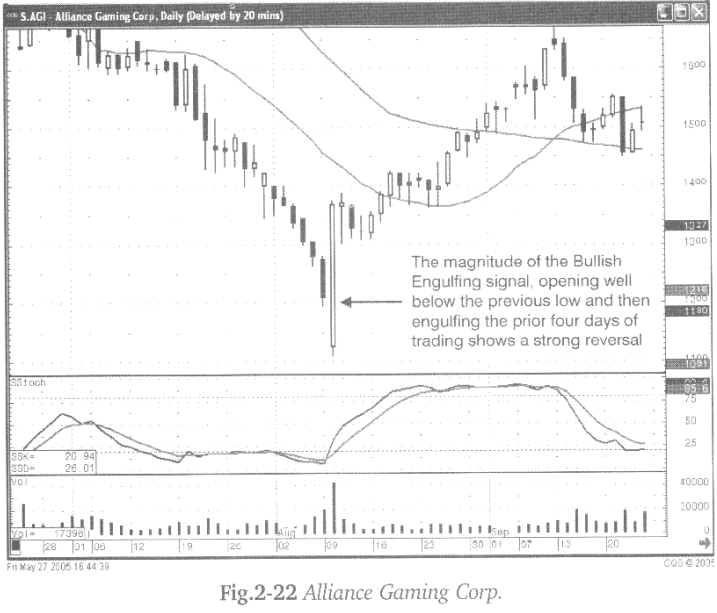
The
Alliance Gaming Corp. Chart Fig. 2-22 (following page), is a prime example of a
reversal signal. A large bullish engulfing signal occurring with oversold
stochastics and an inordinate amount of volume. This clearly represents that
the existing negative sentiment of the trend has been completely altered.
The
further the engulfing body opens below the close and/or the trading range of
the previous day, and then closes above the previous days open, the higher the
probability and the more forceful the uptrend will be. This incorporates the common-sense
aspects that candlestick analysis conveys. Where do most investors sell? Panic
selling at the bottom! That is where the Bullish Engulfing signal starts its
formation. The deeper the selling, starting the Bullish Engulfing formation,
the more convincing that all the weak stock has finally been sold into the
strong hands. The further a Bullish Engulfing signal closes above the previous
day’s candle, engulfing one, two, three or more previous candles, the more
compelling the reversal signal.
Stochastics are Excellent Indicators for Overbought and Oversold Conditions
When are you near a bottom? When your indicators, such as stochastics, tell you the trend is in an oversold condition. Also, when you can identify selling at the bottom. Keep in mind, the oversold condition can last for a long period of time as shown in the Alliance Gaming Corp. chart. A gap down at the bottom, then the formation of a strong bullish engulfing signal bringing the stochastics of the oversold condition becomes a very relevant reversal signal.
Fig.
2-23, the Digene Corp. chart illustrates the classic reversal signal. The last
day of the downtrend shows aggressive selling. This should be the first alert
for watching for a candlestick “buy” signal. The following day forms a Bullish
Engulfing signal. A Bullish Engulfing signal has more significant ramifications
when both candles have “long days”.
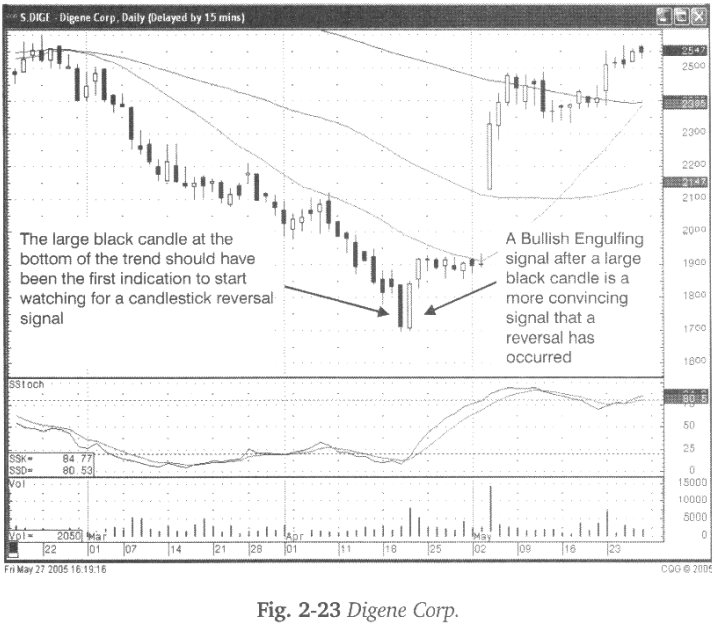
(Long
days are identified when the size of the candle is larger compared to the
majority of the other candles within the immediately preceding area on the
chart. Generally, two or three weeks of previous candle formations are
sufficient to judge the average candle size.) Simply stated, the sellers were
in a hurry to get out of the trade. The next day, the Bulls clearly
demonstrated that they were getting into the trade.
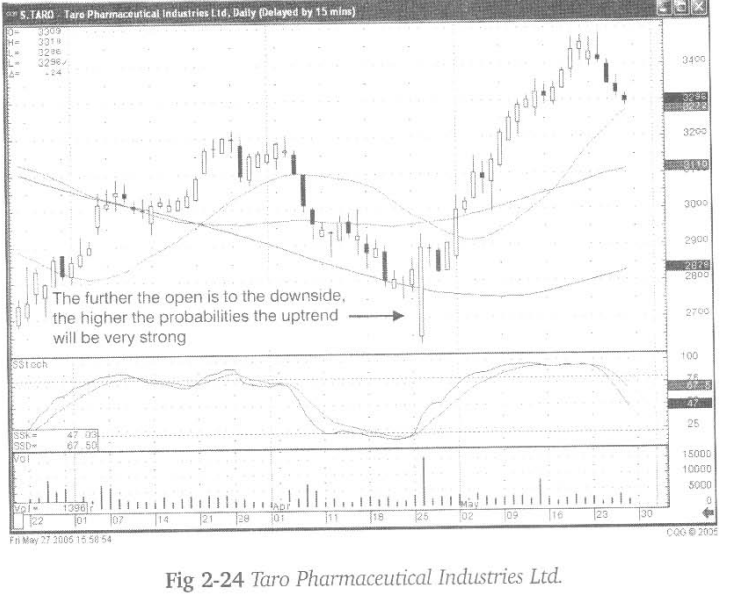
The Taro
Pharmaceutical Industries Ltd. Chart Fig. 2-24, is an example of investors
wanting to get out, no matter what. After nearly a month of selling, the final
gap-down demonstrates the extensive desire for investors to get out of the
position. The fact that once the price opened, started moving up, and finished
above the previous day’s trading, clearly signifies the Bulls had stepped into
this position. The previous day was not a black candle and therefore, technically
not a Bullish Engulfing signal, nonetheless the fact that you had a huge
Bullish Engulfing signal drat actually engulfed the previous four days of
trading provides a significant message. The buyers had stepped in at the
bottom.
Does
identifying a candlestick reversal signal always foretell that a new trend is
starting? Not all the time! But the “probabilities” are extremely high a reversal
will occur. Will that new trend start up immediately? Not necessarily, but the
signal occurring in the correct conditions increases the likelihood a new trend
should be starting. If not immediately, very soon.
Witnessing
a bullish signal in oversold condition conveys the information an investor
should be looking for. The buyers have started moving into the position. The
uptrend may not start immediately. As witnessed in Fig. 2-25, the IXYS Corp.
chart, the first Bullish Engulfing signal occurred with stochastics in the
oversold condition. The uptrend fizzled. However, that did not negate the fact
that a bullish signal formed in an oversold condition. Even though that uptrend
did not get started, the oversold condition was still in existence.
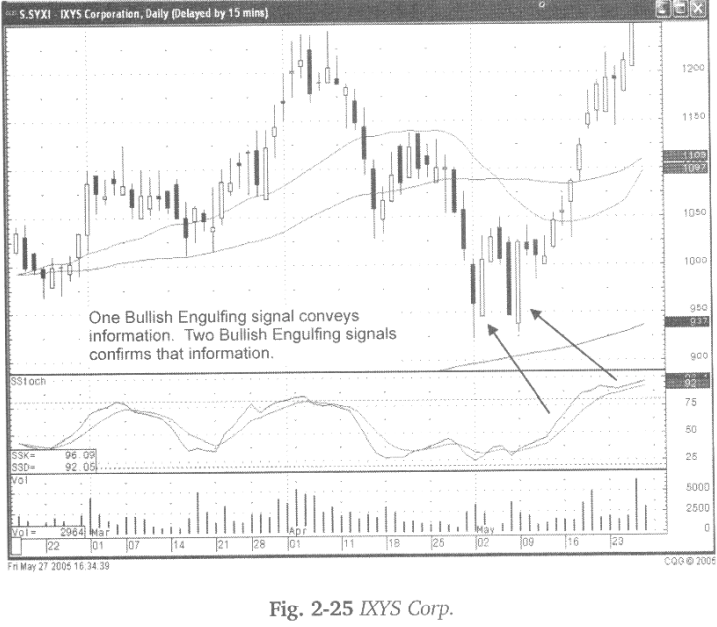
If the
first Bullish Engulfing signal failed, the second Bullish Engulfing signal will
be more significant. The Bears see the buying from the first bullish signal.
They are relieved when there is no follow-through buying. However, when they see
the second Bullish Engulfing signal, the Bears realize that the Bulls are back
again. They finally step out of the way. If one Bullish Engulfing signal
indicates the buyers are stepping in, then two Bullish Engulfing signals
indicate the buyers are serious.
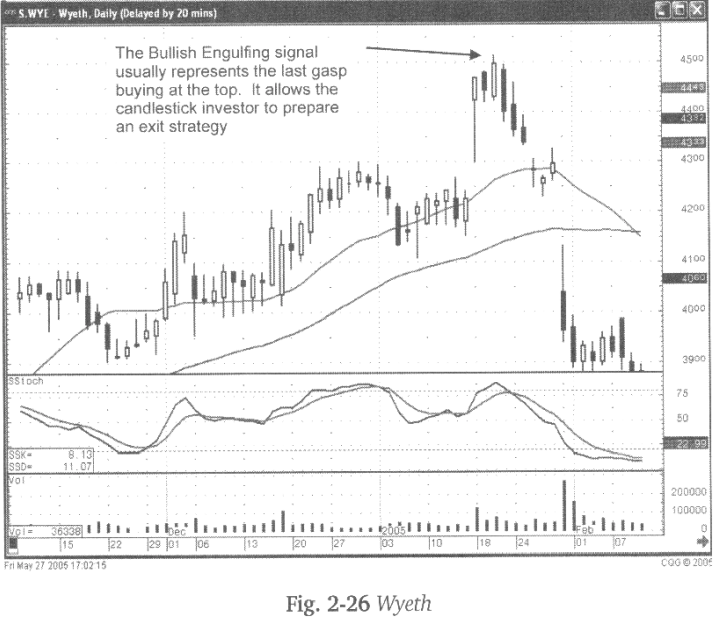
It makes good sense that when a Bullish Engulfing signal is witnessed in an oversold condition, a trend reversal is likely to occur. But what happens if you see a bullish engulfing signal occurring in an overbought condition? As a Bull, that would be a comforting event. However, the Japanese Rice traders used a Bullish Engulfing signal in overbought condition as an ‘alert’ to start watching for candlestick “sell” signals. The rationale is that the Bullish Engulfing signal, at the top of a trend, is usually the last gasp buying.
How can
this information be used to the candlestick investor’s advantage? First, if
long a position and you observe some toppiness with a Bullish Engulfing
signal, be prepared to close out the position. If short a position, based upon
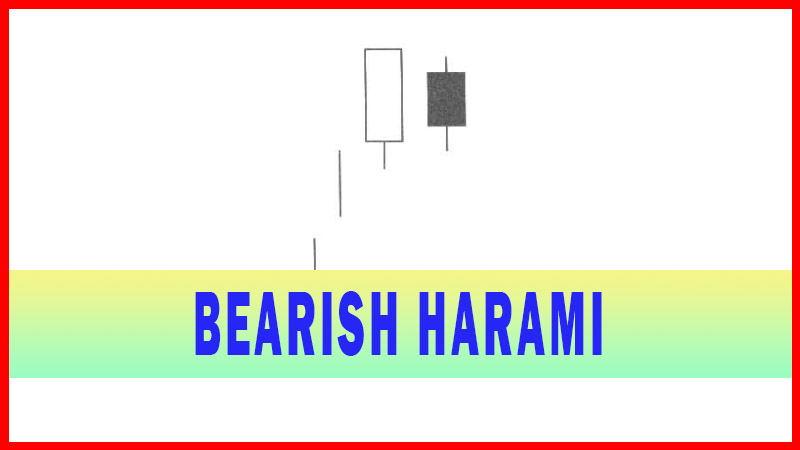
a candlestick sell signal, such as a Bearish Harami, followed by a Bullish Engulfing
signal, you should be less inclined to cover the short position. The trend
would require further buying after the Bullish Engulfing signal to indicate the
uptrend is still in force. Otherwise, be prepared for the price to start
heading down.
Fig.
2-26, The Wyeth chart illustrates the Bullish Engulfing signal occurring in the
overbought condition acting as the last gasp buying. The logical stop loss in
this trade, if long, would have been at the low of the Bullish Engulfing signal
day. The logic being; that if this stock was still in an uptrend, it should not
be coming back down through the low of the last bullish candle.
The
Bullish Engulfing signal has graphic characteristics that make it easily identified.
As a major signal, a Bullish Engulfing signal will be viewed often during
scans. They will appear every single day somewhere. They work very effectively
when stochastics is in oversold conditions. They also work effectively at
important support levels such as a trend lines or major moving averages.
The
information conveyed in a Bullish Engulfing signal is very simple. The Bulls
have come into a position with reasonable force. That buying force more than
negated the previous day’s trading. Use that knowledge to your advantage.
How To make High Profit In Candlestick Patterns : Chapter 1. The Major Candlestick Signals : Tag: Candlestick Pattern Trading, Forex : Major reversal pattern, Engulfing pattern, Engulfing body, Engulfing Trading strategy, Trend reversal Pattern - Bullish Engulfing Pattern