Inverted Hammer Pattern
Hanging Man signal, inverted hammer candle, inverted hammer candlestick pattern, inverted hammer candlestick pattern
Course: [ How To make High Profit In Candlestick Patterns : Chapter 1. The Major Candlestick Signals ]
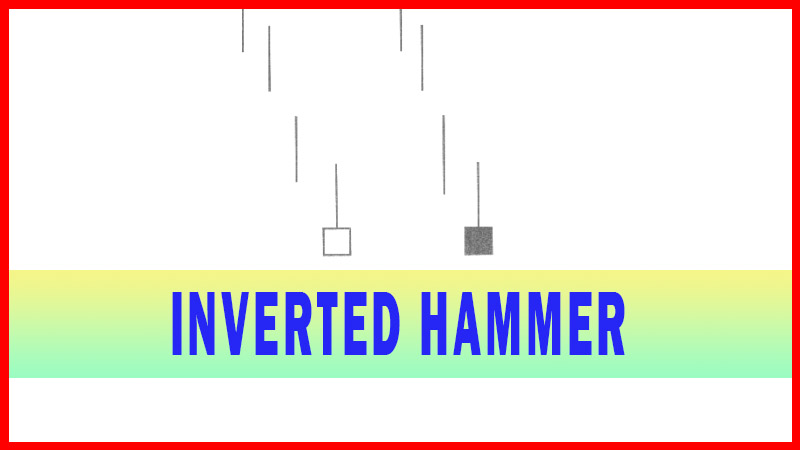
The Inverted Hammer incorporates the reverse interpretation of the Hanging Man signal. Found at the bottom of a downtrend, this shows evidence the Bulls started to step in, but that selling was still going on. After a downtrend has been in effect, the atmosphere is very bearish. The price opens and starts to trade higher.
INVERTED HAMMER (Tohba)

Description
The
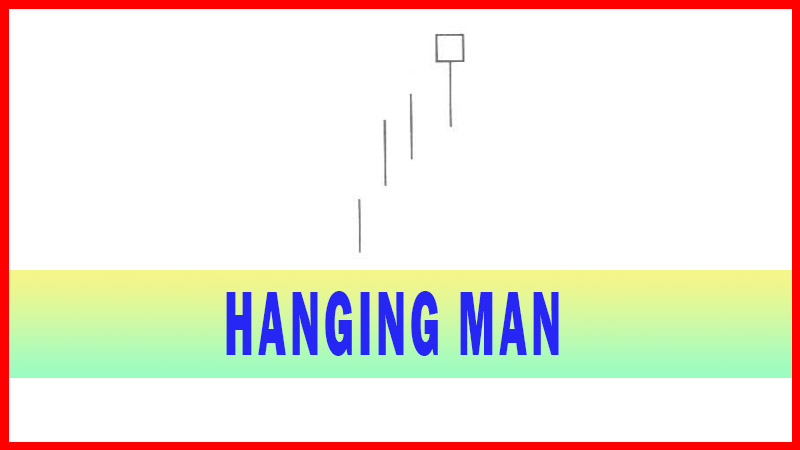
Inverted Hammer incorporates the reverse interpretation of the Hanging Man
signal. Found at the bottom of a downtrend, this shows evidence the Bulls
started to step in, but that selling was still going on. After a downtrend has
been in effect, the atmosphere is very bearish. The price opens and starts to
trade higher. The Bulls have stepped in. But they can’t maintain the strength.
The existing sellers knock the price back down to the lower end of the trading
range. The Bears appeal* to still be in control. It has the aspects of being a
bearish signal.
The
mental effect of the Inverted Hammer creates cause for concern for the bears.
Although the price closes back down near the low of the day, the buying that
day had the Bears worried. The next day, if prices open higher, the Bears are
thinking, “darn, the Bulls are still at it.”
If the Bears see that the Bulls are being persistent, they start getting out of
the way. The higher the price moves up before being pushed back down, the more
consternation it will have caused for the Bears.
The
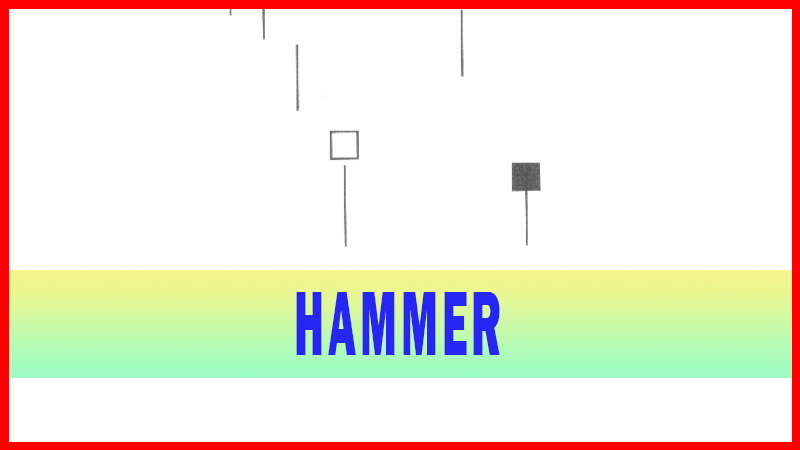
Inverted Hammer is comprised of one candle. It is easily identified by the
presence of a small body with a shadow at least two times greater than the
body. The color of the small body is not important but a white candle has
slighdy more bullish implications than the black body. A bullish candle is required
the following day to confirm this signal.
The
signal is also a very high probability signal. It does not occur as often as
most of the other major signals, but when it does, it will usually produce
positive trade results. It also provides an excellent stop loss format.
Purchasing a position on a positive open on the following day is the correct
entry process. However, if the price would then close below the low point of
the Inverted Hammer, a simple deduction can be made. The Bulls were not in
control. Close it out immediately.
Criteria
1.
The upper shadow should be at
least two times the length of the body.
2.
The real body is at the lower end
of the trading range. The color of the body is not important although a white
body should have slightly more bullish implications
3.
There should be no lower shadow
or a very small lower shadow.
4.
The following day needs to
confirm the Inverted Hammer signal with a strong Bullish day.
Signal Enhancements
1.
The longer the upper shadow, the
higher the potential of a reversal occurring.
2.
A gap down from the previous
day's close sets up for a stronger reversal move provided the day after, the Hammer
signal opens lower.
3.
Large volume on the Inverted Hammer
Day increases the chances that a blow off day has occurred.
The most
informative factor conveyed in an Inverted Hammer signal is the fact that the
buying started. Although the sellers appeared to have maintained control by
the end of the day, the Bears had noticed that some buyers had gained
confidence in this price area. This may have caused a tinge of doubt to come
into the Bear’s thinking. The bearish sentiment that may have been stronger in
the earlier parts of the downtrend should now create some questions.
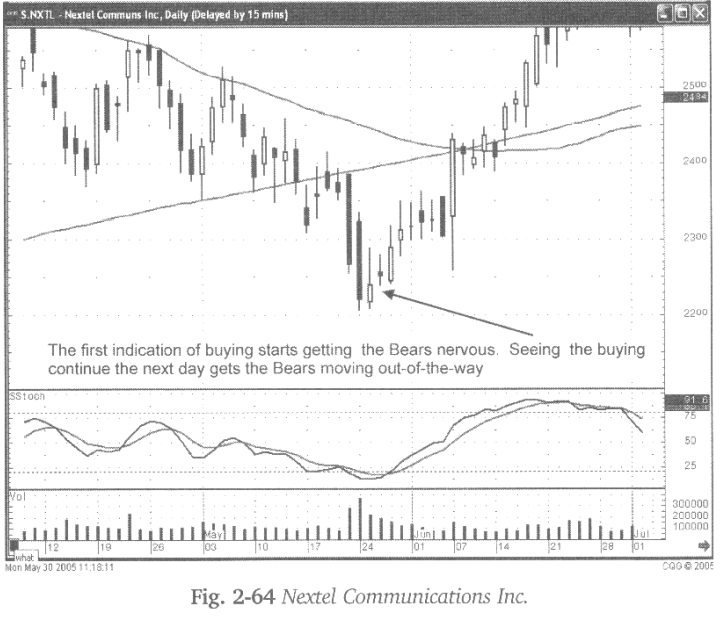
A gap up
in price clearly indicates that the bullish sentiment is definitely in control.
The probabilities become extremely high that an uptrend is in process when the
prices gap up following the signal. The definition of a gap up in the case of
the Inverted Hammer would be a price opening above the body of the signal. That
could mean the price opening up in the upper shadow area or above the high of
the Inverted Hammer trading range. Of course, the higher the next day’s open,
the greater the probability that the uptrend will show strength. Fig. 2-64, the
Nextel Communications chart reveals a positive open, although a Doji day, it
still revealed the buyers coming into the price again.
The
candlestick investor, understanding what this signal is doing to the psychology
of the Bears, can now be prepared. If the bearish sentiment is waning, as
indicated by an Inverted Hammer signal, then the bearish sentiment should
become less pronounced upon seeing more buying. A position entry strategy
becomes simple. If the price appears to be opening positive following the Inverted
Hammer, the candlestick investor can start buying immediately.
If the
eye becomes trained to recognize the signals, then it produces a format for
entering trades at the optimal entry areas. The key word in this statement is
areas. Most investors allow ego to dictate an entry strategy. The sense of
pride for entering a trade at the absolute lowest point becomes an overriding
factor. What most investors forget is that investing is for the purpose of
maximizing profits. The challenge of getting into a trade at the lowest possible
entry level diminishes the effectiveness of a good investing program
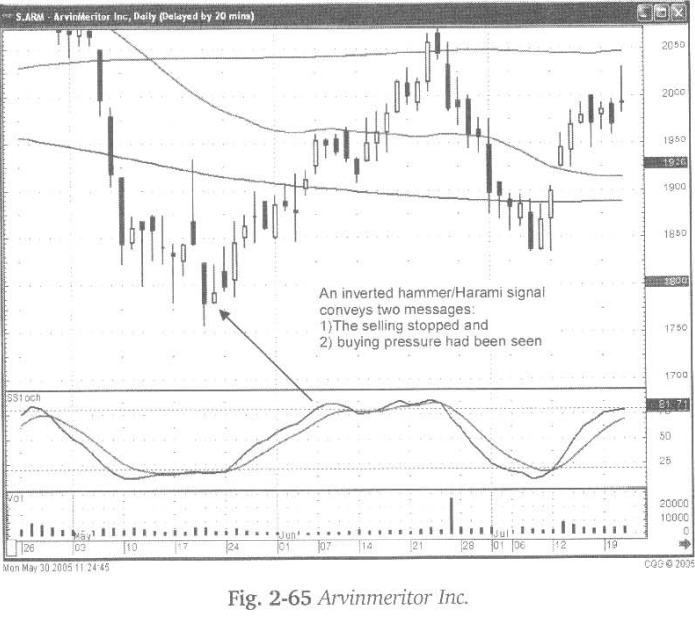
Fig. 2-65
the Arvinmeritor Inc. chart demonstrates an Inverted Hammer acting as a Harami
signal also.
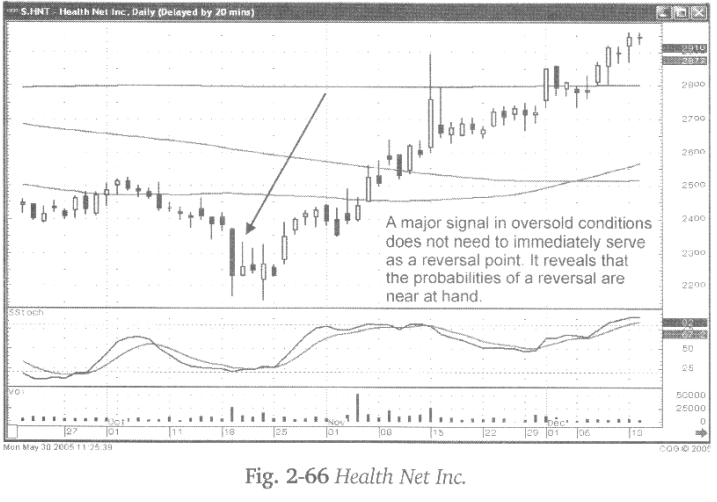
The
candlestick signals are a function of a change in investor sentiment. Not a
function of anticipating where the absolute bottom will be. The Health Net Inc.
chart illustrates what an Inverted Hammer foretells. The appearance of the
signal implies that the buyers have stepped in at what could be perceived as
the bottom. Will that necessarily mean the uptrend will start immediately? Sometimes,
it does, sometimes it doesn’t. But what it does demonstrate is that buying
started, probably putting an end to the downtrend.
The
candlestick investor is anticipating strong buying indications. Even though the
buying may not appear immediately, the fact that the Inverted Hammer appeared
indicates a change in investor sentiment should be experienced soon. Fig. 2-66 the
Health Net chat illustrates that the Inverted Hammer signal was the first signs
of the buyers stepping in. It took a few days for the remaining selling to be
finished.
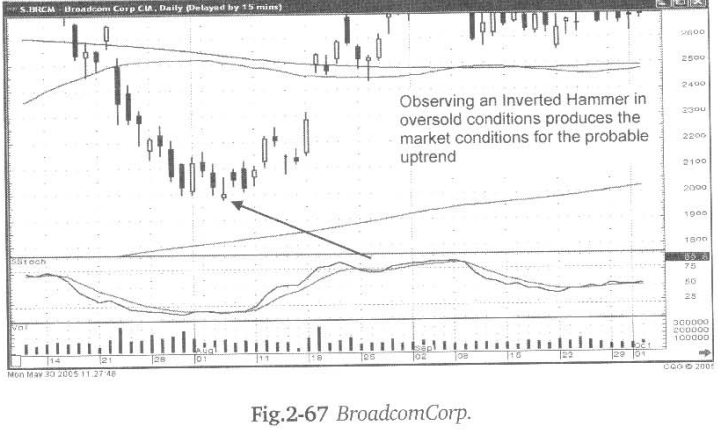
The same
illustration can be seen in Fig. 2-67, the Broadcom Corp. chart. Although the
trading following the Inverted Hammer signal did not reveal dramatic strength
immediately, it eventually acted as the bottom. The shadows to the upside
indicate buying, which needs to be included into the visual analysis. Something
in investor sentiment is changing. That knowledge gives the candlestick
investor an advantage. The Japanese Rice traders viewed this signal for
centuries. Understanding the psychology that creates a signal aid an investor
to understanding what is expected in the trend results.
How To make High Profit In Candlestick Patterns : Chapter 1. The Major Candlestick Signals : Tag: Candlestick Pattern Trading, Forex : Hanging Man signal, inverted hammer candle, inverted hammer candlestick pattern, inverted hammer candlestick pattern - Inverted Hammer Pattern