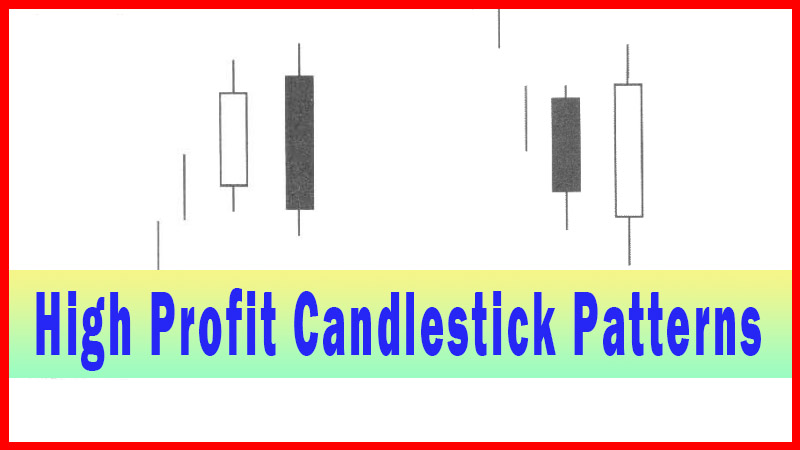
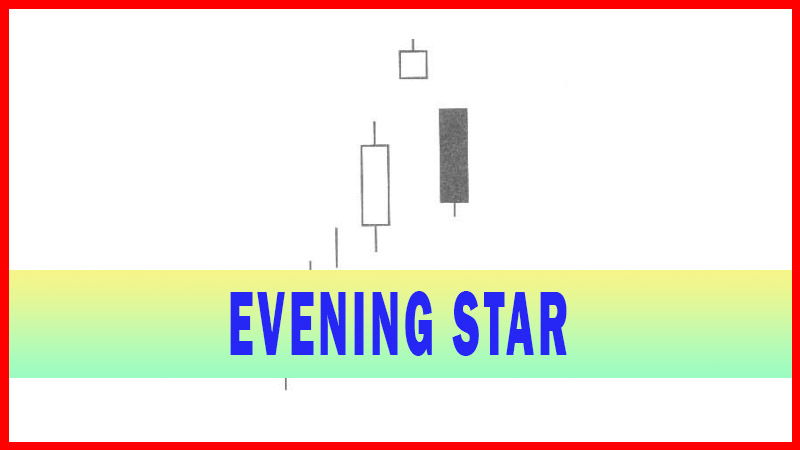
The Dynamic Doji
Doji Star, Doji pattern, Candlestick Pattern, Doji trend, Reversal pattern
Course: [ How To make High Profit In Candlestick Patterns : Chapter 1. The Major Candlestick Signals ]
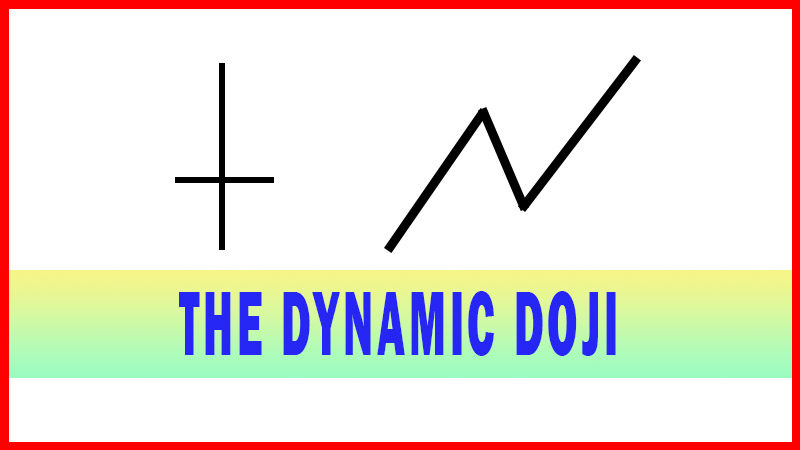
The Doji it is the most recognized candlestick signal. Its formation, essentially looking like a cross, has relevant implications. It illustrates indecision during a specific time period between the Bulls and the Bears.
THE DYNAMIC DOJI SIGNAL
Doji Star
Description
The Doji it is the most recognized candlestick signal. Its formation, essentially looking like a
cross, has relevant implications. It illustrates indecision during a specific
time period between the Bulls and the Bears. The Doji is also comprised of one
candle. The Japanese say when a Doji occurs, one should always take notice. It
is one of the most important Candlestick signals. The formation is created when
the opening price and closing price are the same or nearly the same. This forms
a horizontal line. It is an important alert at both the top and bottom of
trends. At the top of a trend, the Doji signals a reversal without needing
confirmation. The rule of thumb is that you should close a long or go short
immediately.
However,
the Doji occurring during the downtrend requires a bullish day to confirm the
trend reversal. The Japanese explanation is that the weight of the market can
still force the trend downward. The Doji is an excellent example of the
Candlestick method having superior attributes compared to the Western bar
charting method. The deterioration of a trend is not going to be as apparent
when viewing standard bar charts.
Criteria
1.
The open and the close are the
same or very near the same.
2.
The length of the shadow should
not be excessively long, especially when viewed at the end of a bullish trend.
Signal Enhancements
1.
A gap, away from the previous
days close, sets up for a stronger reversal move.
2.
Large volume on the signal day
increases the chances that a blow-off day has occurred although it is not a
necessity.
3.
It is more effective after a long
candle body, usually an exaggerated daily move compared to the normal daily
trading range seen in the majority of the trend.
A Doji at the Top
Illustrations in the following chapters will
not have explanations of every indicator. The stochastic settings for all the
charts are 12,3,3. The moving averages are the 50 day and 200-day simple moving
averages. If a question of which is which, the 50-day MA will be the more
volatile of the two.
The Doji becomes an extremely significant reversal signal when
viewed at the top of a trend. The definition of a top of a trend is a function
of the stochastic’s in an overbought condition. The Japanese rice trader’s
scenario is easy-to-understand. After an extensive uptrend, the
appearance of a Doji is an illustration the Bulls and the Bears have reached a
point of equilibrium. The price has finally reached a level where the bullish
buying pressure is being equalized by the Bears selling into them. A Doji at the
top becomes an immediate sell signal. The Japanese Rice traders say to start
taking your profits. A Doji in the overbought condition becomes more relevant
following a large white candle or a gap-up. A large white candle or a gap-up
signifies the exuberant buying coming in at the top of a trend. That
exuberance, followed by a Doji, becomes a very strong signal that a reversal is
about to occur.
In early
2004, Fig.2-11, TASER International Inc. was the stock that just would not
quit. It moved from the low single-digit price range up to the mid-30s in just
a few months. Of course, it was well-publicized on the financial news stations.
The higher it moved, the more it became debated as to whether it still had huge
upside potential or was way over-priced.
If you
were long, where did you take profits? If you are looking to short the stock,
where did you want to get in? The Doji at the top in mid-April provided a very
clear answer. Notice how the price of TASER stock started moving exuberantly in
the first part of April, 2004. The long bullish
candle, after a small gap-up, with stochastics in the overbought condition,
should have been an alert to start watching for a candlestick ‘sell’ signal.
That signal became clearly apparent the following day with a large Doji signal.
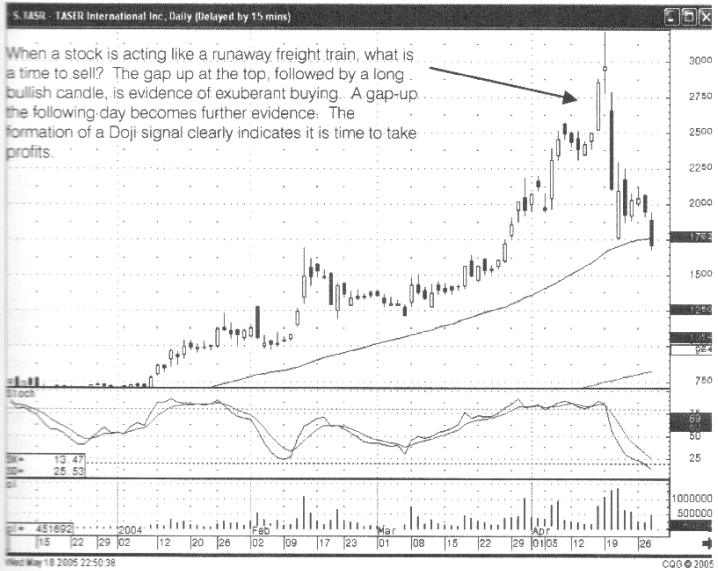
Fig. 2-11
TASER International Inc – early 2004
The Doji
became the sell signal. The evidence of exuberant buying, followed by a Doji
formation, would have allowed an investor to take profits near the very top of
the trend. Could the price have continued higher? Certainly! However, remember
that the Japanese Rice traders have analyzed these circumstances for hundreds
of years. The probabilities of a top reversal signal occurring is a function of
witnessing exuberant buying followed by a gap up Doji signal. The Japanese Rice
traders have recognized that this is time to sell. The gap-down open, the
following day, clearly illustrates that the sellers have stepped into this
trade.
If it is assumed that the signals have significance, then we would not be looking at them today if they did not work. Selling upon the appearance of a Doji is a high-probability profitable result. Exuberant buying followed by a Doji equals ‘sell’!
When the
greed sets in, and the exuberant buying becomes visually apparent, be prepared
to take profits. Viewing big price moves at the top of a trend, followed by a
Doji, especially when that Doji gaps up at the top, take the profits. What is
occurring when these formations occur? Investor sentiment deciding that
everything is apparently so rosy for the future, they want to get in at any
price. The question always needs to be raised “If everything is so great, who
is selling?” The answer is usually the smart money.
The price
of TASER International Inc. Fig.2-12, illustrated again the Doji at the top
creating the reversal at the end of 2004. A long bullish candle, in the
overbought condition, followed by a gap up Doji illustrates that the uptrend
should be over. How do you exit the trade? Investors that have access to computer
screens during the final 30 minutes of trading will be able to witness a Doji
forming near the end of the day. They can close out their position on the close.
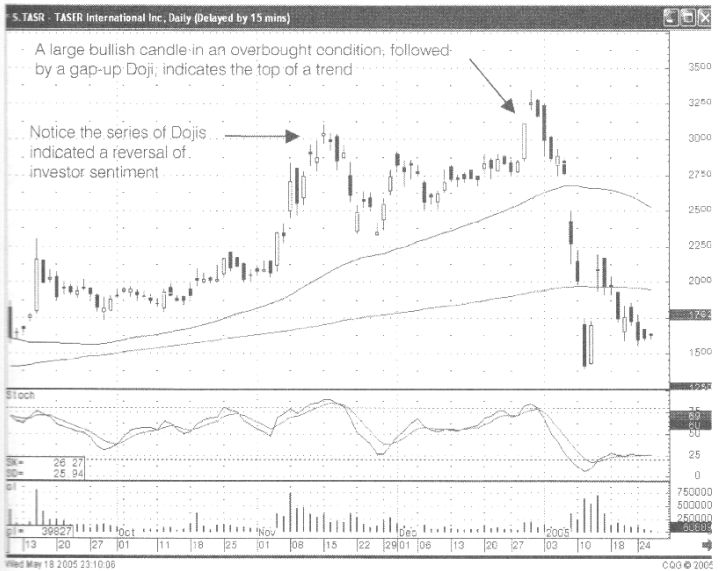
Fig.2-12 Taser International Inc. - late 2004
For the
investor that does not have access to the markets during the day, the 'sell
stop’ can be placed for the next days trading. A logical stop loss point would
be at the low of the trading of the previous days Doji signal. If the selling
came back down through that point, that would be a clear indication that the
sellers had now started coming into the trade.
The
gap-up at the top of a trend can have many conclusions. A gap-up followed by a
long bullish candle has different implications than a gap-up that forms a Doji.
As illustrated in the Photonics Inc. chart, Fig. 2-13, a gap-up Doji indicated
the top of the trading. Profits should have been taken at the close of the Doji
day or on the lower open the following day. Could a higher price have been achieved?
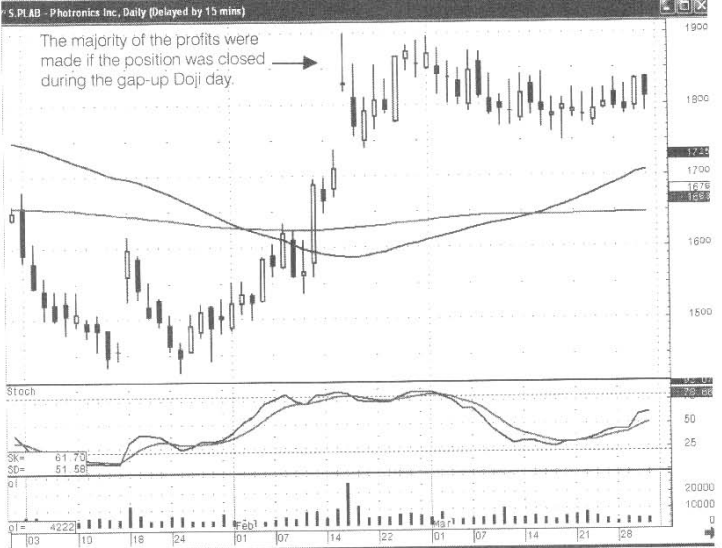
Fig. 2-13
Photonics Inc.
As seen
in this chart, a better price could have been obtained approximately a week
later. However, what is the main point of investing? To maximize your returns
and to do so with the least amount of risk! Holding onto this position for
another week would not have produced the percentage returns to make the risk of
holding that position worth while. As can be seen, the majority of the profits
were made when the price gapped up and formed a Doji.
The point
of investing is not to maximize your profits on each individual trade. It is to
maximize your profits for your account. The majority of the profits were
extracted from this made at the gap up Doji. Those funds now should be moved to
a lower risk trade, one that would have the upside potential as was seen at the
beginning of this trade in mid to late January.
The
appearance of a Doji at an important resistance level such as a trend line also
has significance. Notice in Fig.2-14, the Cadence Design Systems Inc. chart,
how a Doji, in the overbought, condition forms right at a trend line. The major advantage of candlestick signals is that they indicate
immediately what the investor sentiment is doing at important levels.
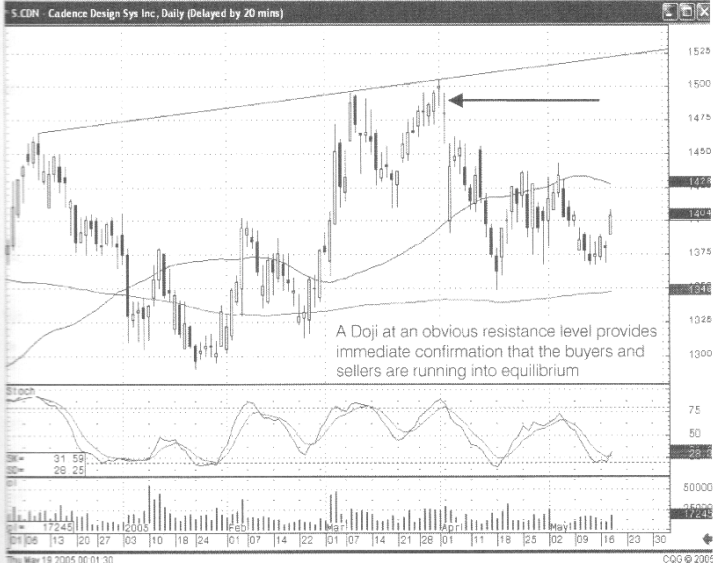
Fig. 2-14 Cadence design Systems
Inc
Witnessing
a Doji, at what everybody else might be anticipating as a resistance level,
provides an immediate confirmation that the buyers and sellers have
participated in indecisive trading. The Doji illustrates that the trend-line
has become resistance once again. It is further confirmed by seeing the selling
the next day when prices gap to the downside.
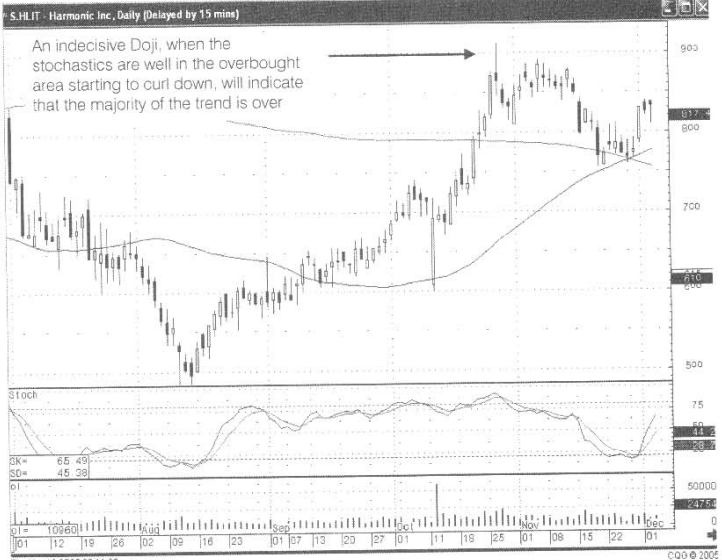
Fig. 2-15 Harmonic Inc
If one
Doji represents indecision, a series of Doji represents a lot of indecision.
Finding a series of Doji is the set up for some powerful trades. Observing a
series of Doji should alert investors that the Bulls and the Bears are having a
hard time deciding which direction the trend should be moving. The more
extensive the series, (the longer the indecision time frame) the more convincing
the trend will be once it breaks out.
A series
of Doji is an excellent warning device. It illustrates that something is about
to happen. Logically, if a series of Doji occur in oversold condition, what
should occur is a move to the upside. Conversely a string of Doji, seen in the
overbought condition, usually indicates the trend is about to turn down. The
caveat to witnessing a large number of Doji forming is analyzing the previous
chart formations. A trading entity that has Doji forming a high percentage of
the time will not be as significantly influenced by more Doji. A series of Doji
becomes more significant when found in a normal trading chart.
As
illustrated in Fig. 2-16, the Frontier Oil chart, after a mild sell-off the
investors became very indecisive. This indecision occurred as the stochastics
came into the oversold condition. One Doji, in an oversold condition, calls to
the attention of an investor to watch for a reversal. Watching a series of Doji
develop allows an investor to take advantage of a strong trend developing right
from the very start.
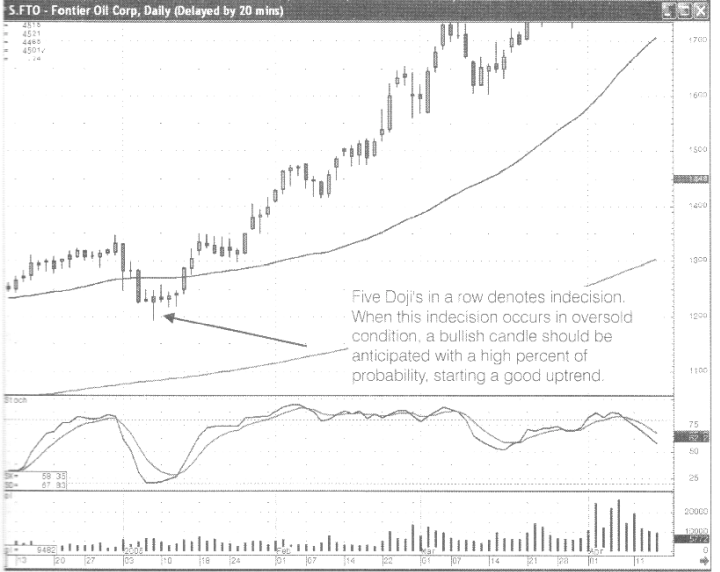
Fig. 2-16 Frontier Oil Corp
What does
a series of Doji represent? Indecision! What does the bullish candle illustrate
after the series of Doji? The investors have now made up their mind which
direction to take the trend. With that knowledge, it becomes an easy process to
watch which direction the trading will move from that indecisive period. The
candlestick investor can start putting on the trade as soon as the price
movement has indicated that the indecision is over. A strong move, from an
indecisive trading range, is an extremely high probability indicator. It can be
acted upon immediately. An indecisive trading range can have many configurations.
As witnessed in Fig. 2-17, the SIRF Technology Holdings Inc. chart, the
indecision after the slight pullback could be viewed. The Doji illustrated that
the downward trajectory was running into indecisive trading.
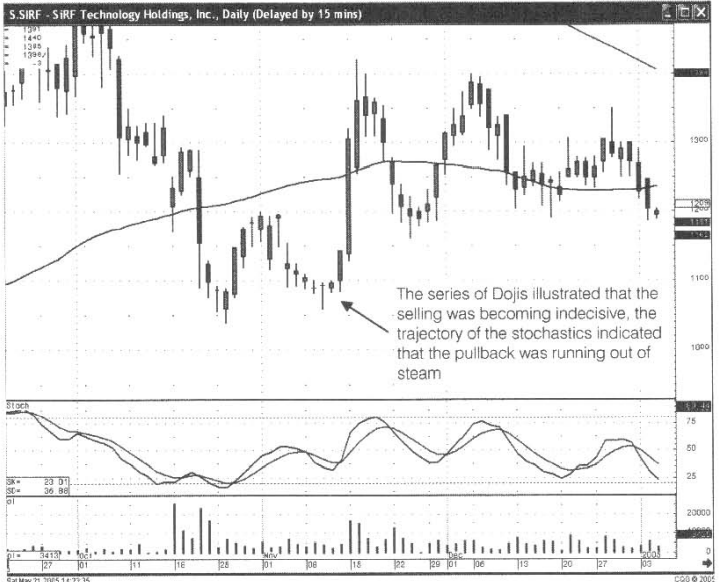
Fig. 2-17 SIRF Technology
Holdings Inc
Although
the stochastics were in mid-range, the series of Doji illustrated that the
selling was waning, giving time for the stochastics to start curling to the
upside. When the trading becomes indecisive at important moving averages, the
investor should become aware of a potential trend change.
That
scenario becomes relatively clear in Fig.2-18, the Champion Enterprises Inc.
chart. Doji/Spinning Tops occurring at a major moving average while stochastics
are starting to move up should be watched. The appearance of a Long-legged Doji
at the end of the series creates additional relevance. The indecisiveness is
growing.
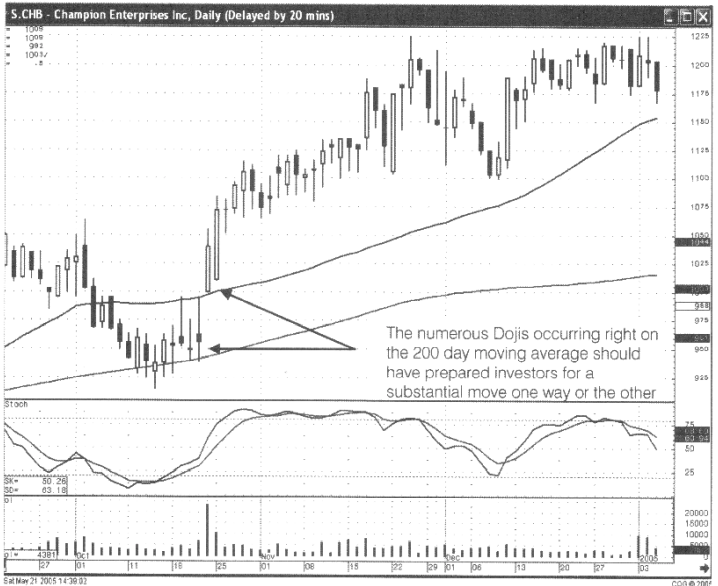
Fig.2-18 Champion Enterprises Inc.
Being
prepared for a major consequence to occur allows an investor to make a purchase
decision quickly. What is expected after a series of Doji? A significant move!
If that is the case, a gap-up or a gap-down immediately illustrates what has
been decided.
In the
case of the Champion Enterprises Inc. Chart, Fig. 2-18, a gap up above the 50-day
moving average, followed by the immediate buying, should have activated a
purchase immediately.
Allow
your eyes to evaluate what the major signals are doing. Keep it simple. As seen
in Fig. 2-19, the Alamosa Holdings Inc. chart, a series of Doji indicated a
bottom in early September. Another series of Doji occurred at the same level at
the end of a month. The Bulls and the Bears were indecisive the first time the
trend pulled back. The Bulls and the Bears were just as indecisive the second
time the trend pulled back to that level.
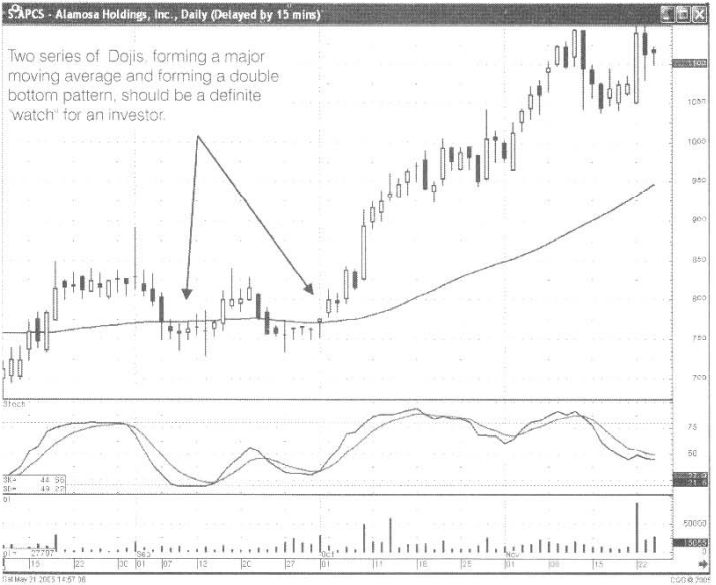
Fig.
2-19, the Alamosa Holdings Inc.
Both
times the series of Doji were revealing valuable information. Something should
happen from these levels. The first rally failed. Is this not contrary to the
implication that a series of Doji, followed by a strong move out of that
trading range, should produce a strong rally? The key word is “probabilities”. Not all series of Doji
are going to be followed by high profit trend. However, an extremely high
percentage of the trends will be strong.
The fact
that the first trend failed does not negate the probabilities that the second
series of Doji will have any less likelihood of being followed by a strong
trend. Realistically, the second time the series of Doji indicated that there
was great indecision at approximately the $7.50 level. A new buying indicator
appeared. The gap up from the 50-day Ma and the stochastics curling back up.
The sellers recognize the persistency of the Bulls.
A series
of Doji occurring near a major moving average has significant implications. Two
series of Doji at the same level, creating a double bottom formation, creates
stronger implications. Will a series of Doji in the oversold condition always
preclude a bullish trend? Will any series of Doji in the overbought condition
always preclude a bearish trend? No! The Doji indicate a major move is about to
occur. The “probabilities” point to a bullish trend after Doji have formed in
the oversold condition. The “probabilities” point to a bearish trend when Doji
are viewed in an overbought condition. The important factor that the Doji
portray is that a major move is likely to occur. As illustrated in Fig. 2-20,
the Dick’s Sporting Goods Inc. chart, the series of Doji was just an indecisive
congestion area in a strong up trend.
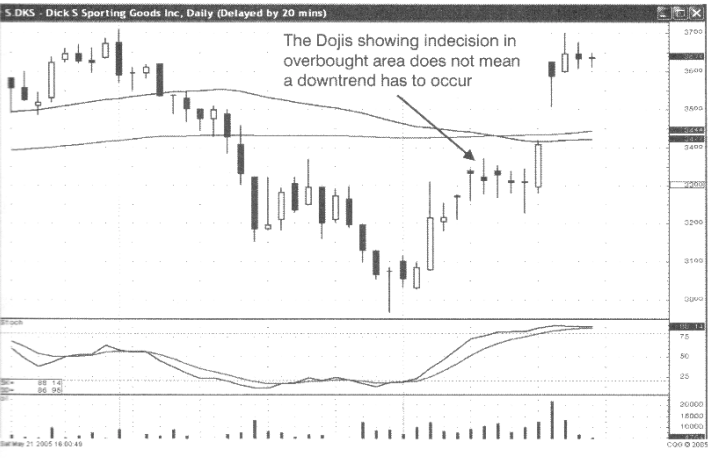
Fig. 2-20
Dicks Sporting Goods Inc.
One Doji,
be prepared. Two Doji, be more prepared. Three Doji, definitely start looking
for something major to happen one way or the other. This can be applied to any
trading entity. Whether you are analyzing the long-term trends in the indexes
or trading minute-by-minute in E-mini S&P trades, the appearance of a large
number of Doji becomes an excellent trade entry warning.
Series of Doji Observations
1.
The bigger the series of Doji,
the more powerful the resulting move from that level will be.
2. A series of Doji, forming in an
oversold condition, represents an extremely high probability that a major
uptrend is about to start.
3.
A series of Doji forming in an overbought
condition represents an extremely high probability that a major downtrend is
about to start.
4.
The initiation of the trend will
be illustrated by a strong candle moving away from the indecision area.
How To make High Profit In Candlestick Patterns : Chapter 1. The Major Candlestick Signals : Tag: Candlestick Pattern Trading, Forex : Doji Star, Doji pattern, Candlestick Pattern, Doji trend, Reversal pattern - The Dynamic Doji