Marubozu Candlestick - The Major Signals
Candlestick Pattern, Bearish marubozu candlestick, Bearish marubozu, Bearish marubozu candle, High Profit In Candlestick Patterns PDF
Course: [ How To make High Profit In Candlestick Patterns : Chapter 1. The Major Candlestick Signals ]
Japanese candlestick investing has inherent aspects that cannot be ignored. This book was written based on one major assumption. If you are reading this, you are looking for a better investment program than what you have been experiencing.
The Major Candlestick Signals
“They
teach in academies far too many things, and far too much that is useless.”
-Goethe
Candlestick
signals have gained popularity in the recent years. Why, if the signals
demonstrate such a high degree of accuracy, have they not been actively used
until recently? The common answer has been that there were too many of them to
learn expeditiously and they did not always seem to work. It was a common assumption
that becoming proficient at candlestick analysis required a long and steep
learning curve.
Fortunately,
the productive utilization of candlestick signals has revealed an important
factor. Of the 50 or 60 candlestick signals, only a dozen signals need to be
learned. These me considered the 12 major signals. What constitutes these
signals being considered the major signals? Most importantly the frequency in
which they occur during trend analysis!
Although
the other signals me effective for analyzing reversals or continuations of
trends, the frequency in which they occur is very small. The mental effort, to
learn and remember the majority of candlestick signals, is not worthwhile. Do
not disregard them! It is suggested that the remaining signals be recognized.
This means visually reviewing the secondary signals and the continuation
patterns. If the eye can be trained to recognize what appears to be a signal,
it becomes more time-effective to go to a reference to verify that a
candlestick signal is occurring. References would include other candlestick
books that have a full description of those signals. The Candlestick Forum site
provides a set of flash cards that have all the signals graphically
illustrated. A description of the signal is on the reverse side. Keep these
near your computer screen for quick reference.
The
reason for downplaying the secondary signals is simple. For every 100
occurrences of a major signal, a secondary signal or continuations signal may
occur once. The occurrence of a secondary signal does not cany as much predictability
as a major signal. There are better trading opportunities available containing
the major signals. Simply stated, the major signals will provide more trade
opportunities and trend analysis situations than most investors require. The
major signals incorporate an extensive amount of information relating to
investor psychology Your time is best spent concentrating on learning the major
signals. It will develop an immense amount of insight into why and where
reversals occur.
Because
of the frequent appearance of the major signals, investors are provided with
more opportunities to make profits once the significance of these signals is
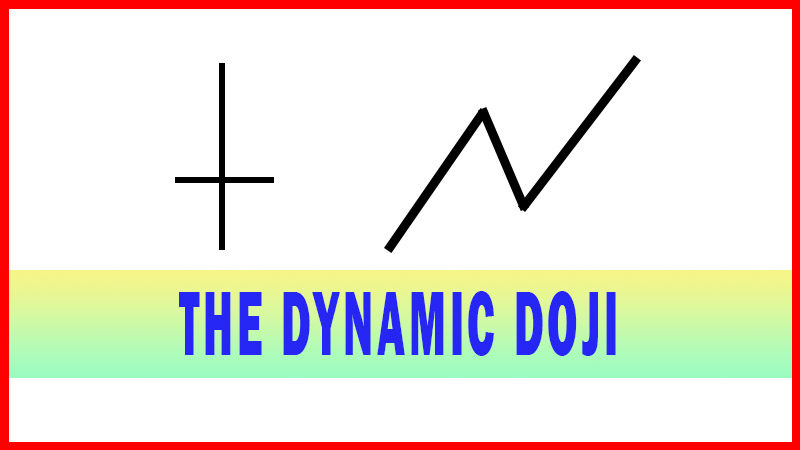
understood. For example, a Doji represents indecision. It is a significant
signal when viewed in overbought or oversold conditions. However, Doji appear
quite often during a trend or during a flat trading period. Understanding the
relationship between the Doji signal and its meaning, depending upon where it
appears in a trend, produces a great advantage for an investor.
The
purpose of evaluating each of the major signals in depth is for the preparation
of exploiting profitable situations. When the eye recognizes a potential
pattern, the mind can be prepared to implement the correct trading strategy The
following illustrations of the major signals should help investors spot high
probability situations.
Western
charting has patterns that indicate reversals of major trends. Head and
shoulders, double tops or double bottoms, island reversals, are a few formations
that have exhibited high degrees of accuracy for identifying change in the
current trends.
Candlestick
analysis enhances an investor’s ability to prepare for trend changes. Being
familiar with the psychology behind specific candle formations provides immense
advantages. Candle signals can identify a trend reversal in one day. More
often, the Candlestick signals can forewarn when a trend is preparing to
change.
A major
trend will probably not have a one-day reversal. It may take a few days or
weeks for the force (psychology of investors) to expend itself and reverse
direction. The appearance of a reversal signal alerts the investor that a
change of investor sentiment has or is about to occur.
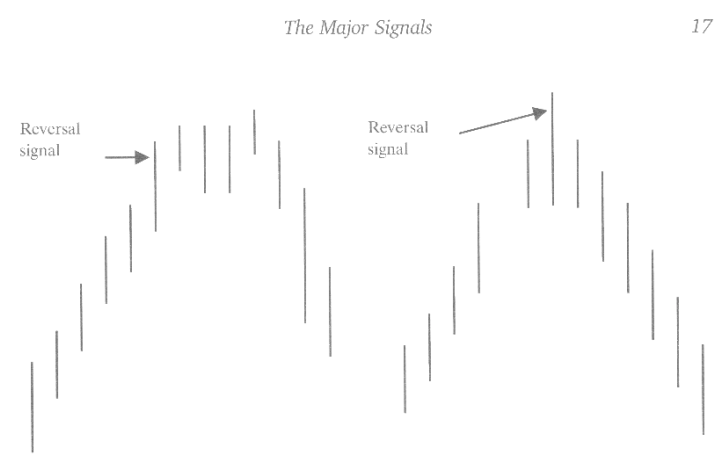
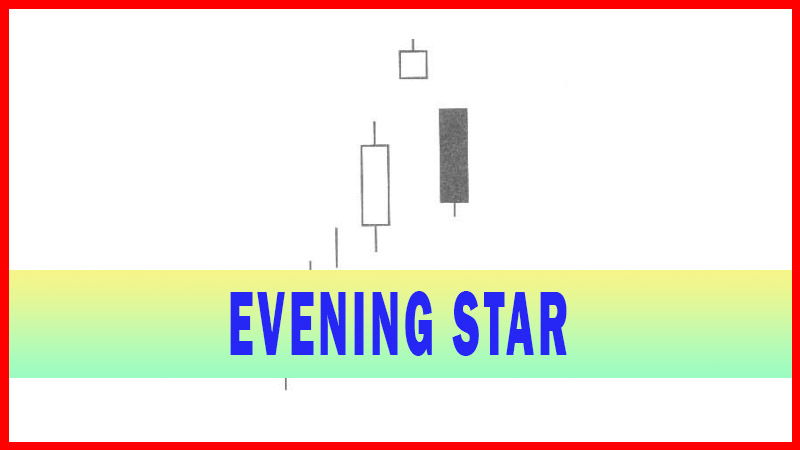
Viewing a
‘sell’ signal at the top of a long up-trend should inform an investor that the
trend might now be losing stream. Will the trend continue up from here? Maybe,
but not with the same potential as putting your investment funds elsewhere! The
trend is starting to lose steam. Quite often, a reversal of a trend can be
clearly illustrated with a candlestick signal at the ultimate reversal point.
Other instances may see a trend reversing slowly with the appearance of major
signals occurring during the reversal pattern. In either case, being able to
identify a major signal in overbought or oversold conditions provides an alert
system for the candlestick investor.
With
these principles in mind, review the rest of this chapter. Learn to visually
recognize these major signals as they will provide more trading opportunities
than most investors can use in a single day. Keep in mind; these signals are
the results of hundreds of years of cultivation. The most important aspect of
this cultivation being PROFITS! Additionally, utilizing other indicators along
with candlestick signals provides a format for identifying not only profitable
trades, but also the high profit trades.
The
signal would have indicated that sellers were stepping in at these levels.
The force
of the trend may still take prices higher. However, with the indications that
the sellers may be stepping in, the strength of the up-trend should be greatly
diminished. The investor can now prepare for the appearance of the next sell
signal. Not all trends reverse immediately. Candlestick signals can illustrate
when a trend is starting to lose strength.
Before
going into the descriptions of the major signals, let us do a quick review of
the basic candlestick formations. Japanese candlestick charting dramatically
increases the information conveyed by visual analysis. Each formation., or
series of formations, clearly illustrates the change of investor sentiment.
This interpretation process is not apparent in standard bar charts. Each candle
formation has a unique name. Some have Japanese names; others have English
names. When possible, in this book, the English name and Japanese name are
given. The Japanese names are illustrated in Romanji, writing so that
English-speaking people can say the names.
Single
candles are often referred to as YIN and YANG lines. These terms are actually
Chinese, but are used by Western analysts to account for opposites; in/out,
up/down, and over/under. INN and YOH are the Japanese equivalents. YIN is
bearish. YANG is bullish. There are nine basic YIN and YANG lines in
Candlestick analysis. These are expanded to fifteen to cover all possibilities.
The combination of most patterns can be reduced to one of these.
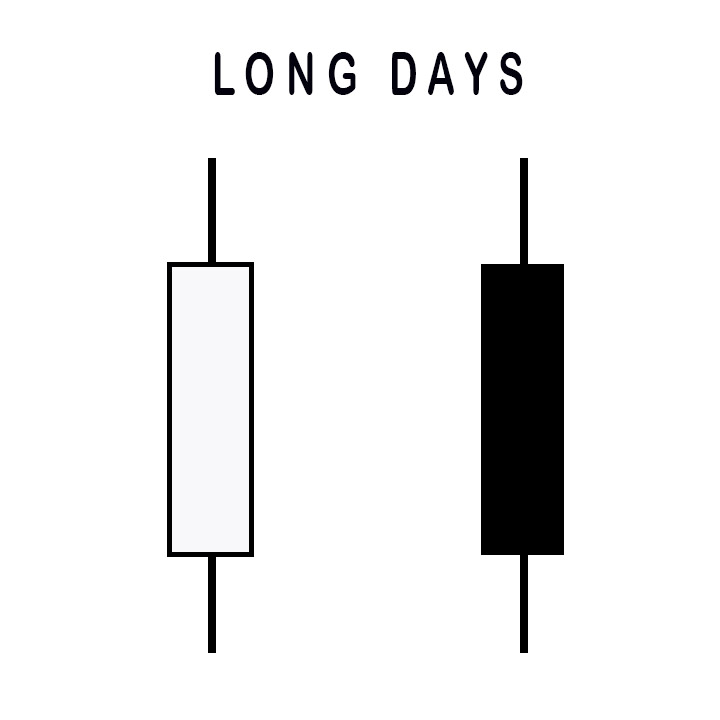
A long
day represents a large price move from open to close. ‘Long’ represents the
length of the candle body. What qualifies a candle body to be considered long?
That question has to be answered relative to the chart being analyzed. The
recent price action of a stock will determine whether a “long” candle has been
formed. Analysis of the previous two or three weeks of trading should be a
current representative sample of the price action.
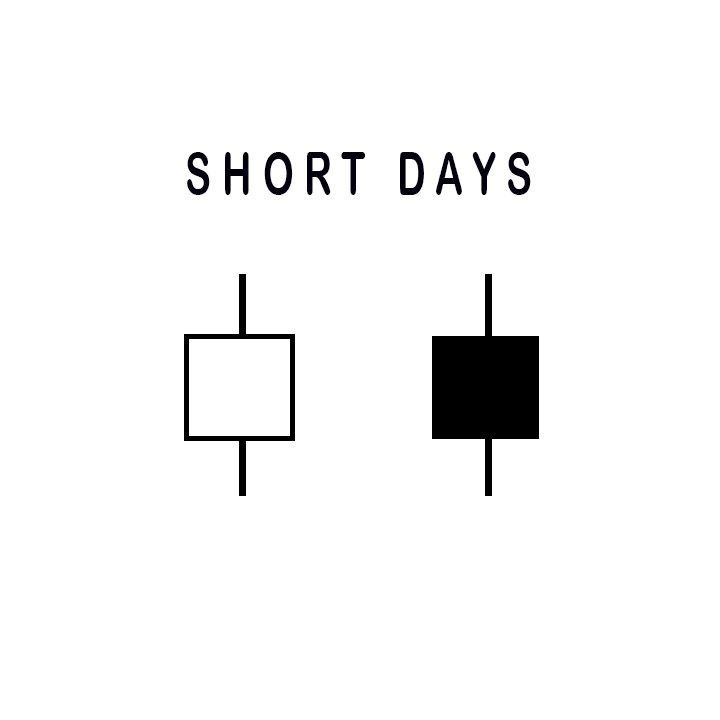
The same
analytical process of the long candles can interpret short days. There are a
large percentage of the trading days that do not fall into either of these two
categories.
Maruboza
In
Japanese, Marubozu means close cropped or close-cut. Bald or Shaven Head are
more commonly used in candlestick analysis. Its meaning reflects the fact that
there are no shadows extending from either end of the body.
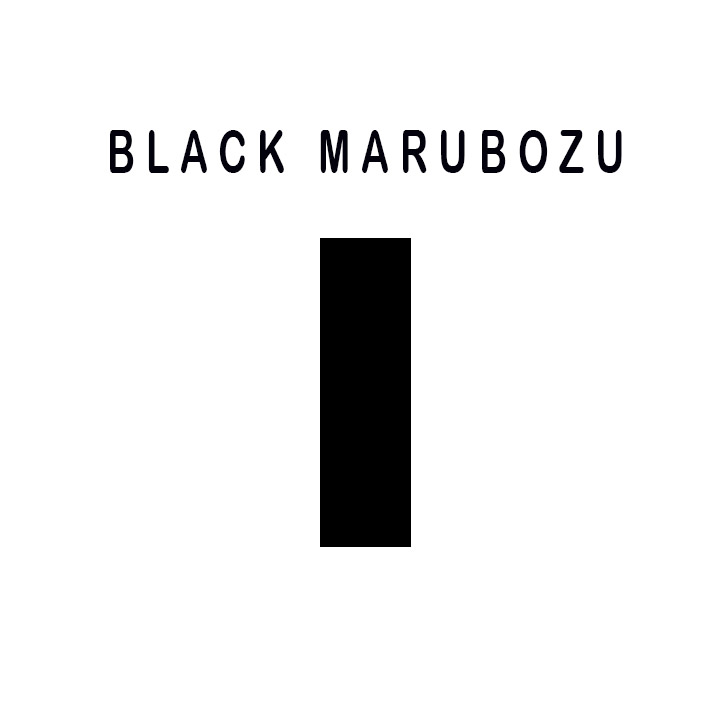
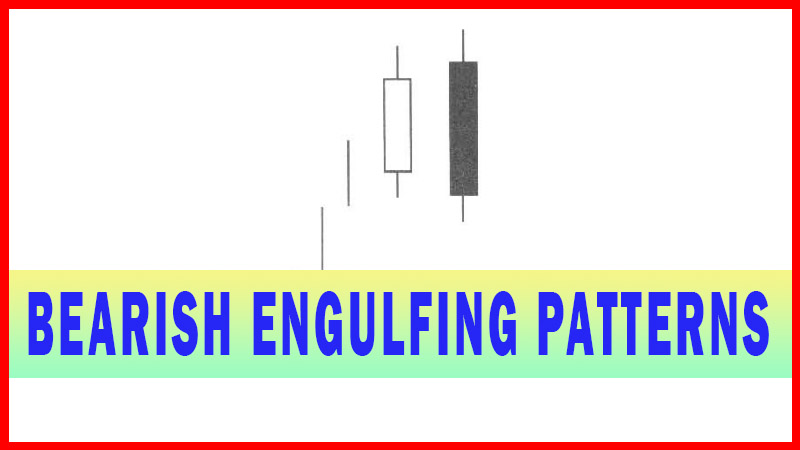
A long
black body with no shadows at either end is known as a Black Marubozu. It is
considered a weak indicator. It is often identified in a bearish continuation
or bullish reversal pattern, especially if it occurs during a downtrend. A long
black candle could represent the final sell off, making it an alert to a
bullish reversal setting up. The Japanese often call it the Major Yin or
Marubozu of Yin.
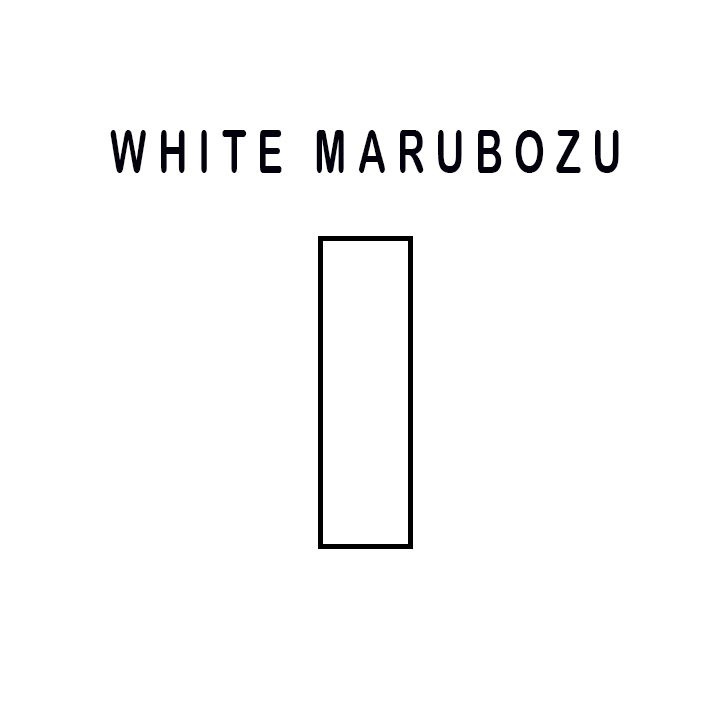
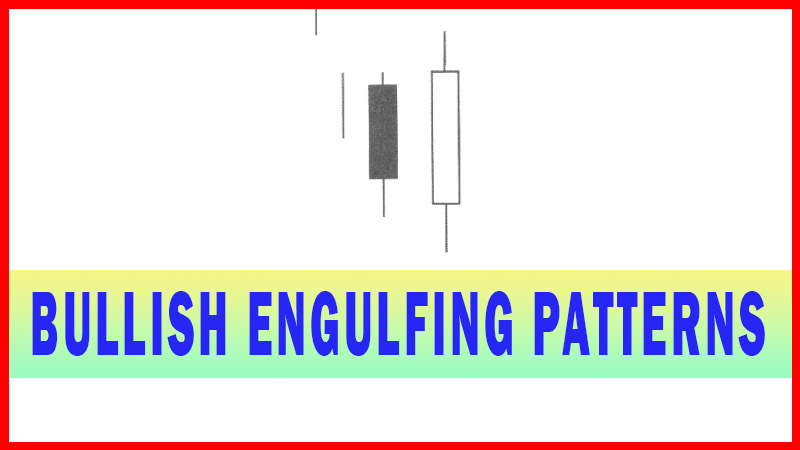
The White
Marubozu is a long white body with no shadows on either end. This is an
extremely strong pattern. Consider how it is formed. It opens on the low and
immediately heads up. It continues upward until it closes, on its high. Counter
to the Black Marubozu, it is often the first part of a bullish continuation
pattern or bearish reversal pattern. It is called a Major Yang or Marubozu of
Yang.
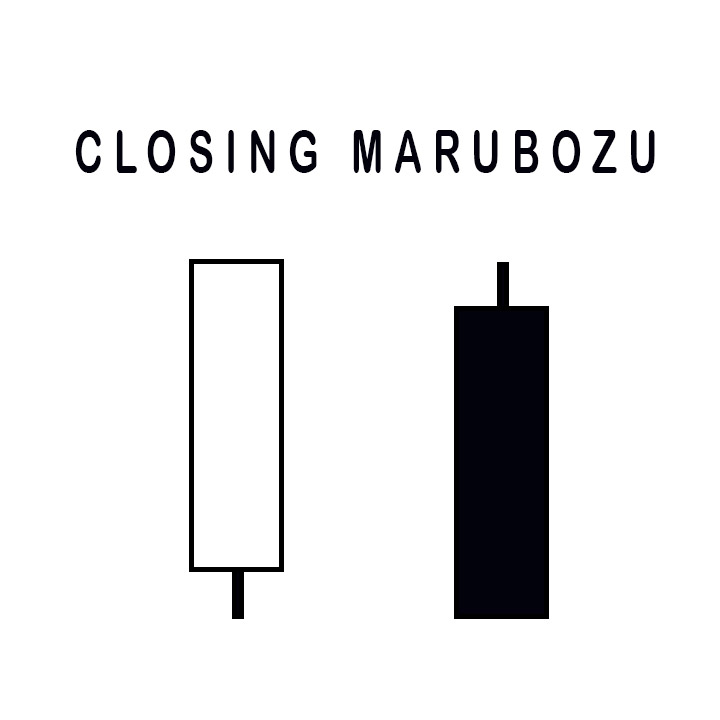
A Closing
Marubozu has no shadow at its closing end. A white body will not have a shadow
at the top. A black body will not have a shadow at the bottom. In both cases,
these are strong signals corresponding to the direction that they each
represent.
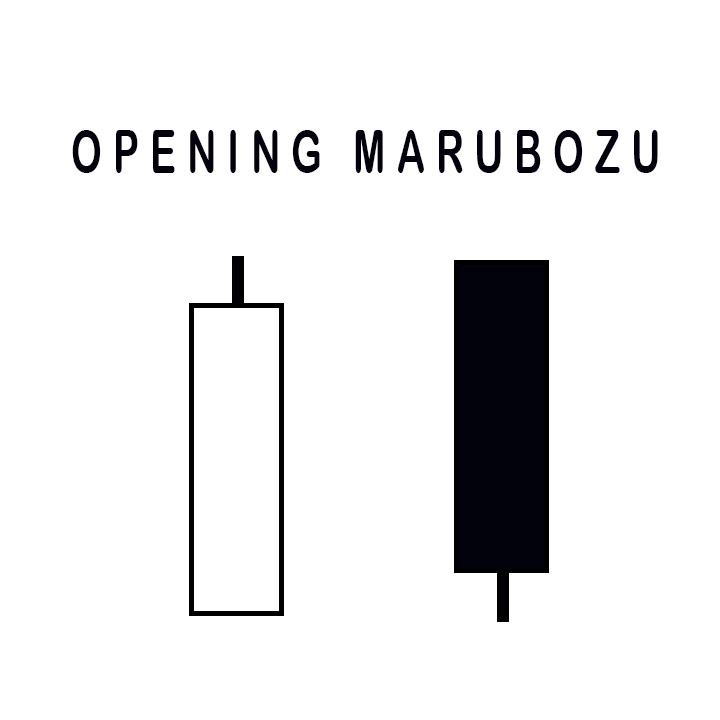
The
Opening Marubozu has no shadows extending from the open price end of the body.
A white body would not have a shadow at the bottom end; the black candle would
not have a shadow at its top end. Though these are strong signals, they are
not as strong as the Closing Marubozu.
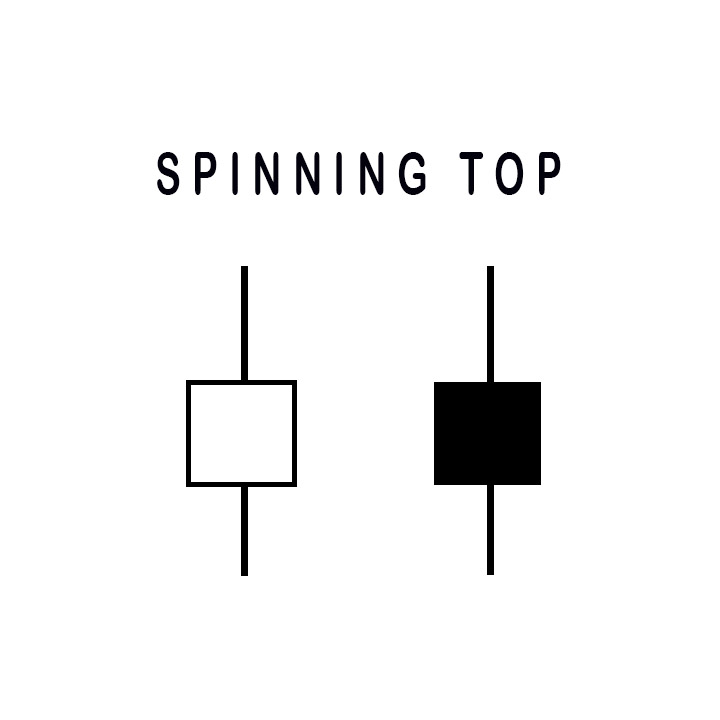
Spinning
Tops are depicted with small bodies relative to the shadows. This demonstrates
some indecision on the part of the bulls and the bears. They are considered
neutral when trading in a sideways market. However, in a trending or
oscillating market, a relatively good rule of thumb is that the next day’s
trading will probably move in the direction of the opening price. The size of
the shadow is not as important as the size of the body for forming a Spinning
Top.
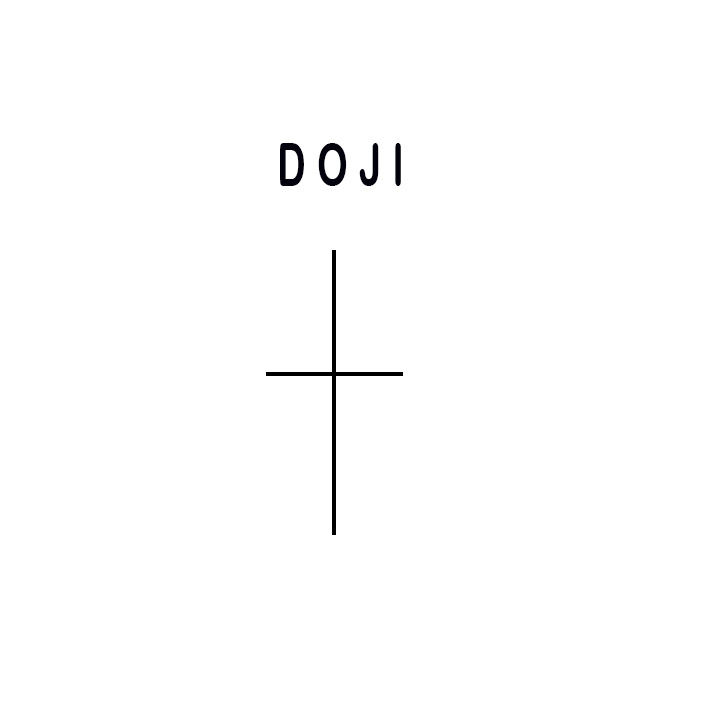
The Doji
is one of the most important signals in candlestick analysis. It is formed when
the open and the close are the same or very near the same. The lengths of the
shadows can vary. The longer the shadows, the more significant the Doji
becomes. More will be explained about the Doji in the next few pages. ALWAYS
pay attention to the Doji.
Being able to recognize the basic formations creates a visual awareness of potential changes in a trend. For example, the formation of a long candle demonstrates more buying or selling sentiment than a normal candle. It may be simplistic but being able to recognize what the formations represent provides valuable information. A long black candle or a series of long black candles after an extended downtrend reveals important information regarding investor sentiment.
A long
black candle at the bottom of an extended downtrend should be a forewarning
that the panic selling is coming into the price. It becomes time to watch for a
candlestick buy signal. The same is true when long white candles start forming
at the top of a trend. That reveals exuberant buying at the top. Watching for a
candlestick sell signal becomes prudent.
The
mainstay of candlestick analysis comes from centuries of observing what occurs
when specific candlestick formations appear. The process of boxing in the open
and the close provides an immense amount of information not found in other
charting techniques.
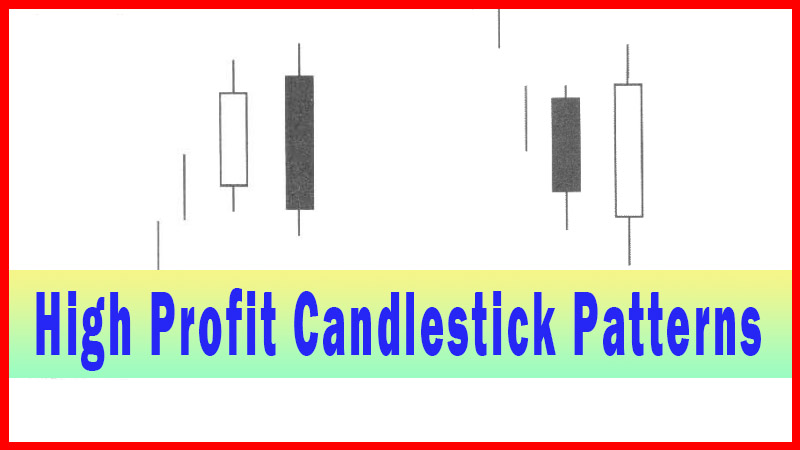
The
following illustrations demonstrate where the major signals work most
effectively. It will incorporate the analysis of candlestick formations leading
up to a potential reversal. This is depicted by purely visual observations. The
candlestick investor has the huge advantage of visually identifying the
weaknesses of human nature.
The
utilization of the 12 major signals is greatly enhanced when the surrounding
investor sentiment can be visually identified prior to a major reversal.
The
remainder of this book will concentrate on how and when the major signals work
most effectively. That will include identifying trend formations that warn a
reversal signal is potentially forming. Also, high profit patterns will be
demonstrated when utilizing candlestick signals. There will not be formulas;
there will not be heavy interpretations. Candlestick analysis is purely a
visual evaluation. The following major signals will be explained in depth.
Being able to recognize chart patterns that have high a profit potential
prepares an investor to take advantage of profitable trades from their
inception. Learning these major signals will greatly simplify the formation of
a consistently profitable trading program.
Scanning
for candlestick signals makes for finding the potential of a reversal.
However, the final analysis reverts back the visual analysis.
The
following illustrations will be of the major signals. The description of these
signals will be done in much greater depth than the descriptions found in
Profitable Candlestick Trading. You may find some of the explanations repetitive.
The important features of the will be repeated to insure that their relevance
is fully understood.
THE MAJOR SIGNALS
·
THE DOJI
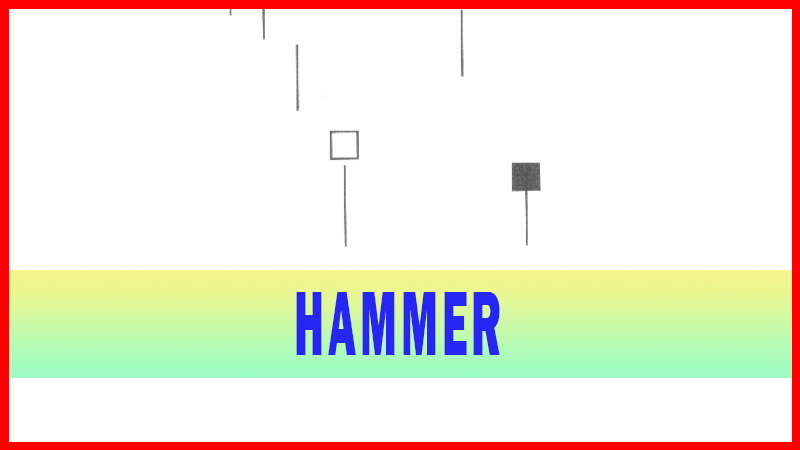
·
HAMMER
How To make High Profit In Candlestick Patterns : Chapter 1. The Major Candlestick Signals : Tag: Candlestick Pattern Trading, Forex : Candlestick Pattern, Bearish marubozu candlestick, Bearish marubozu, Bearish marubozu candle, High Profit In Candlestick Patterns PDF - Marubozu Candlestick - The Major Signals